
DATE: Monday, May 8, 2023 | ITEMS OF |
| 1. | Election of |
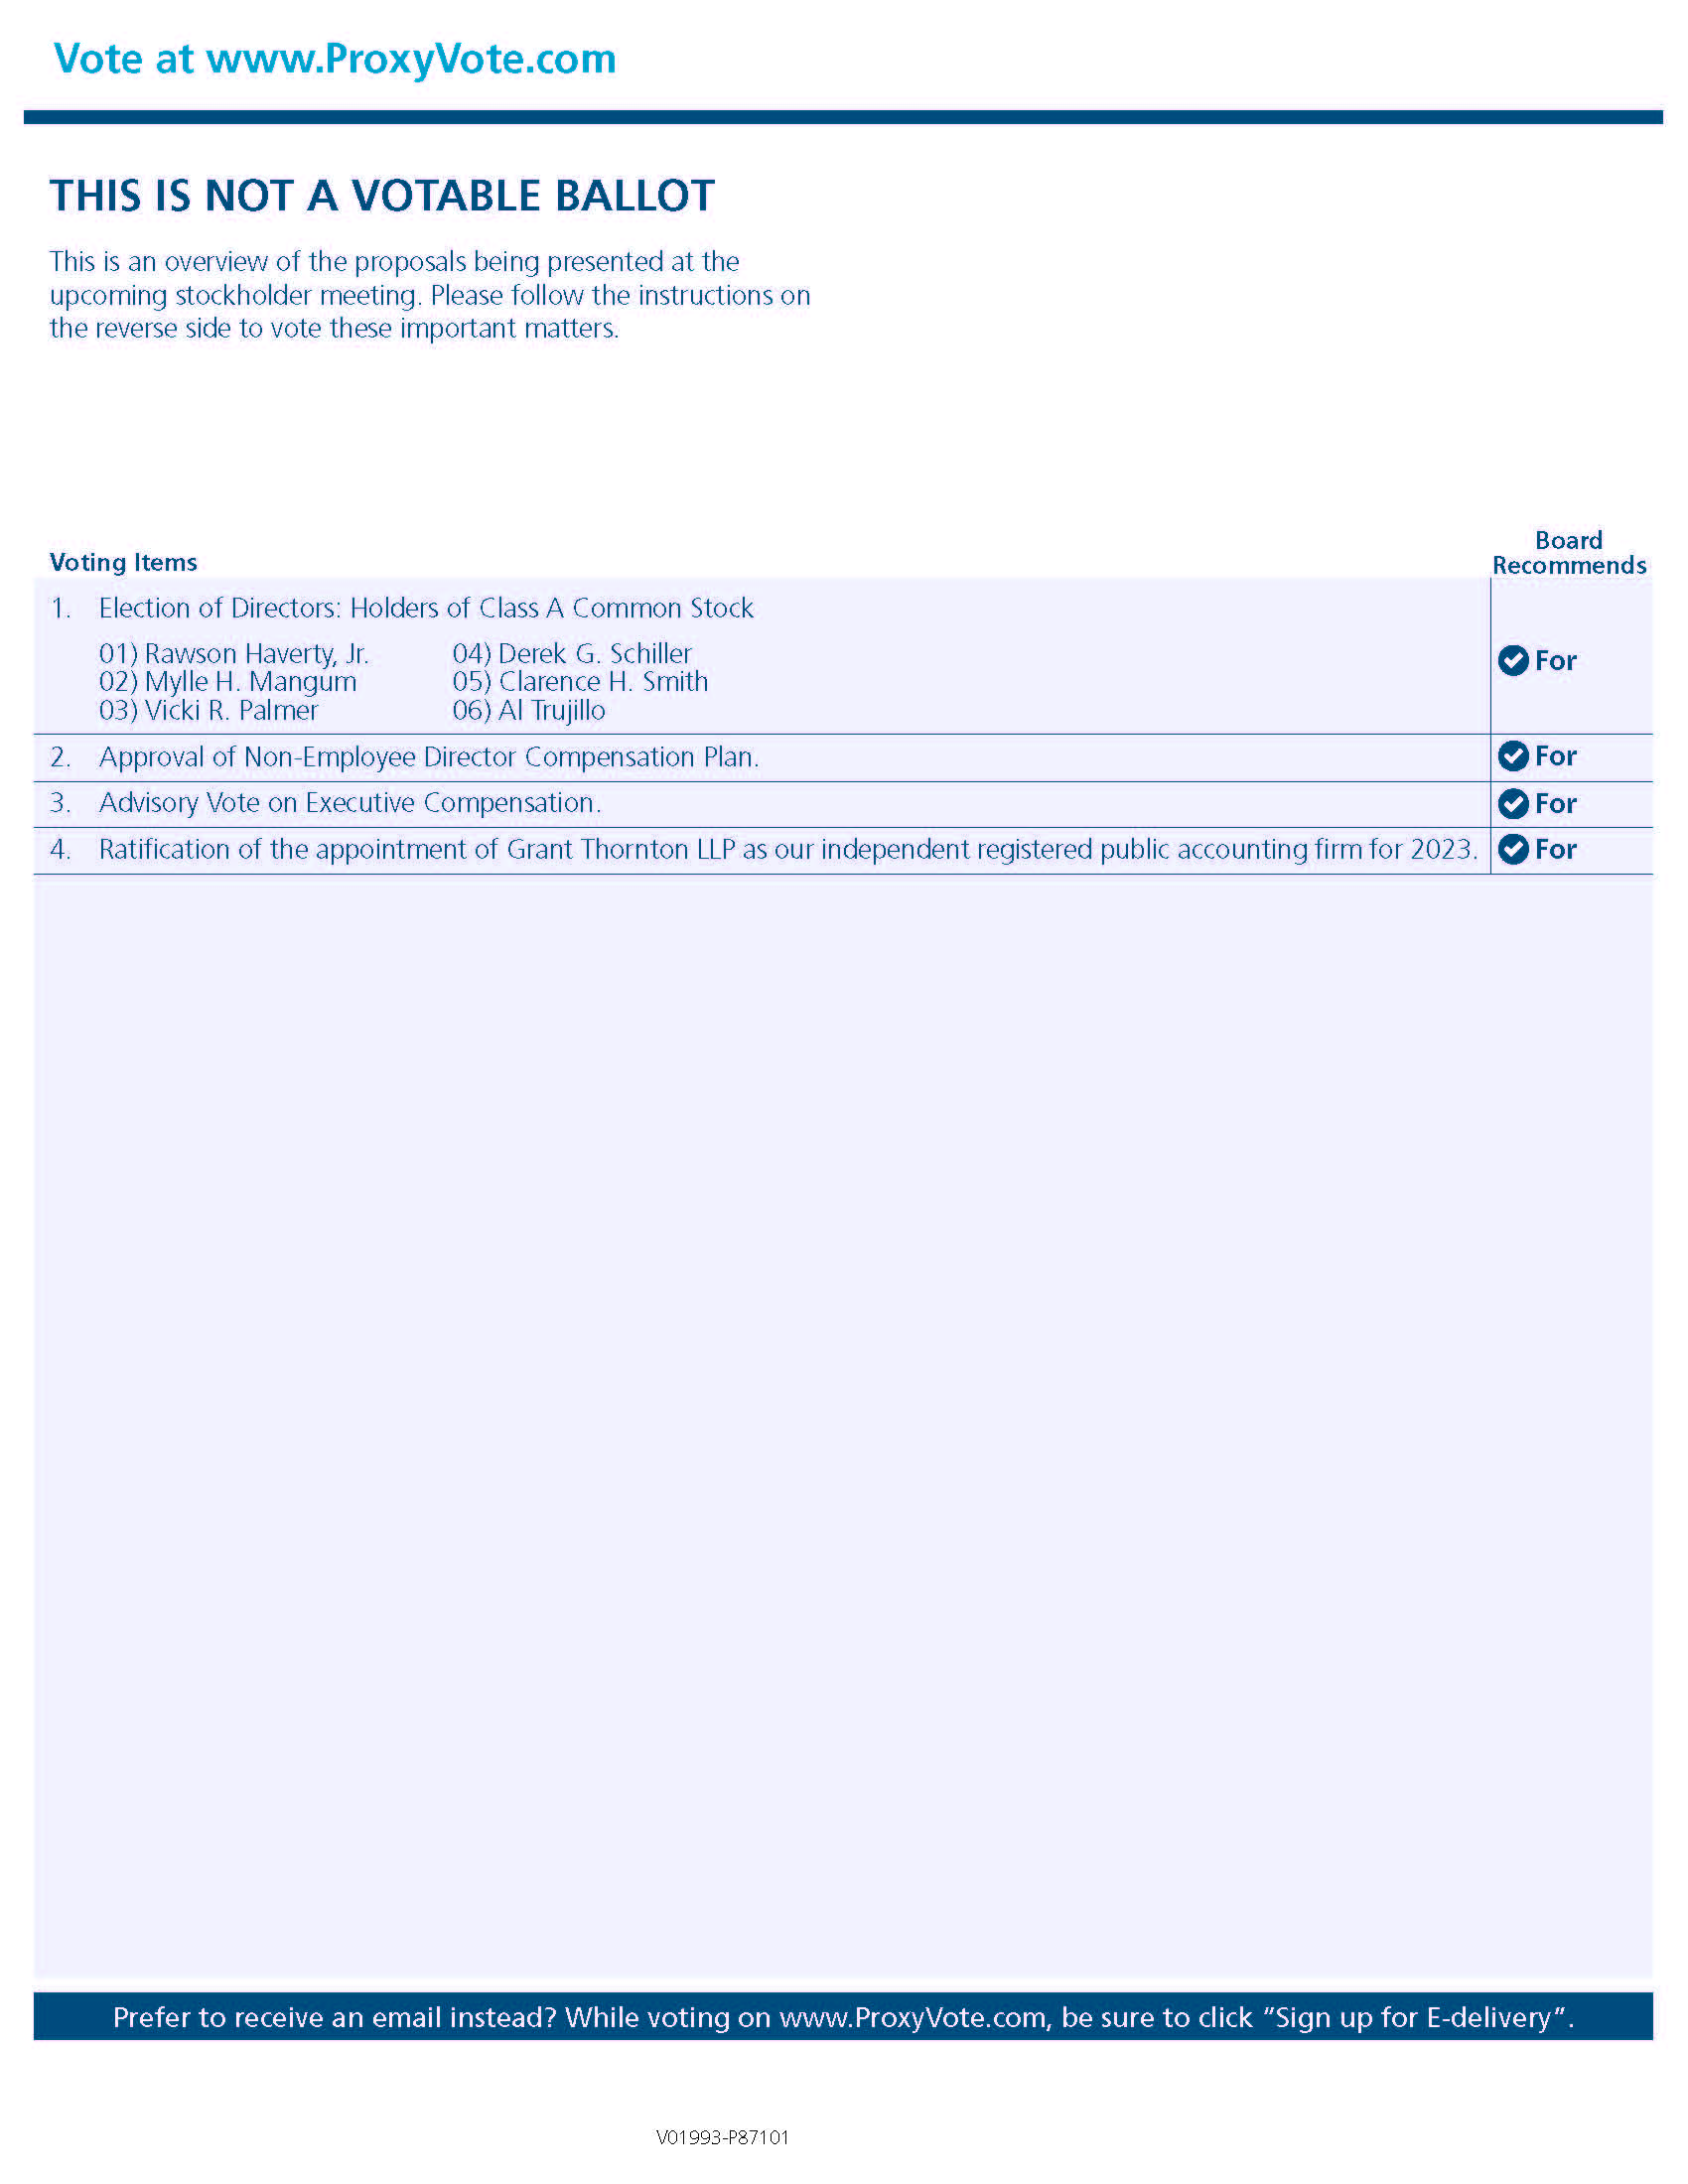
| directors: Holders of Class A Common Stock to elect six directors. | |
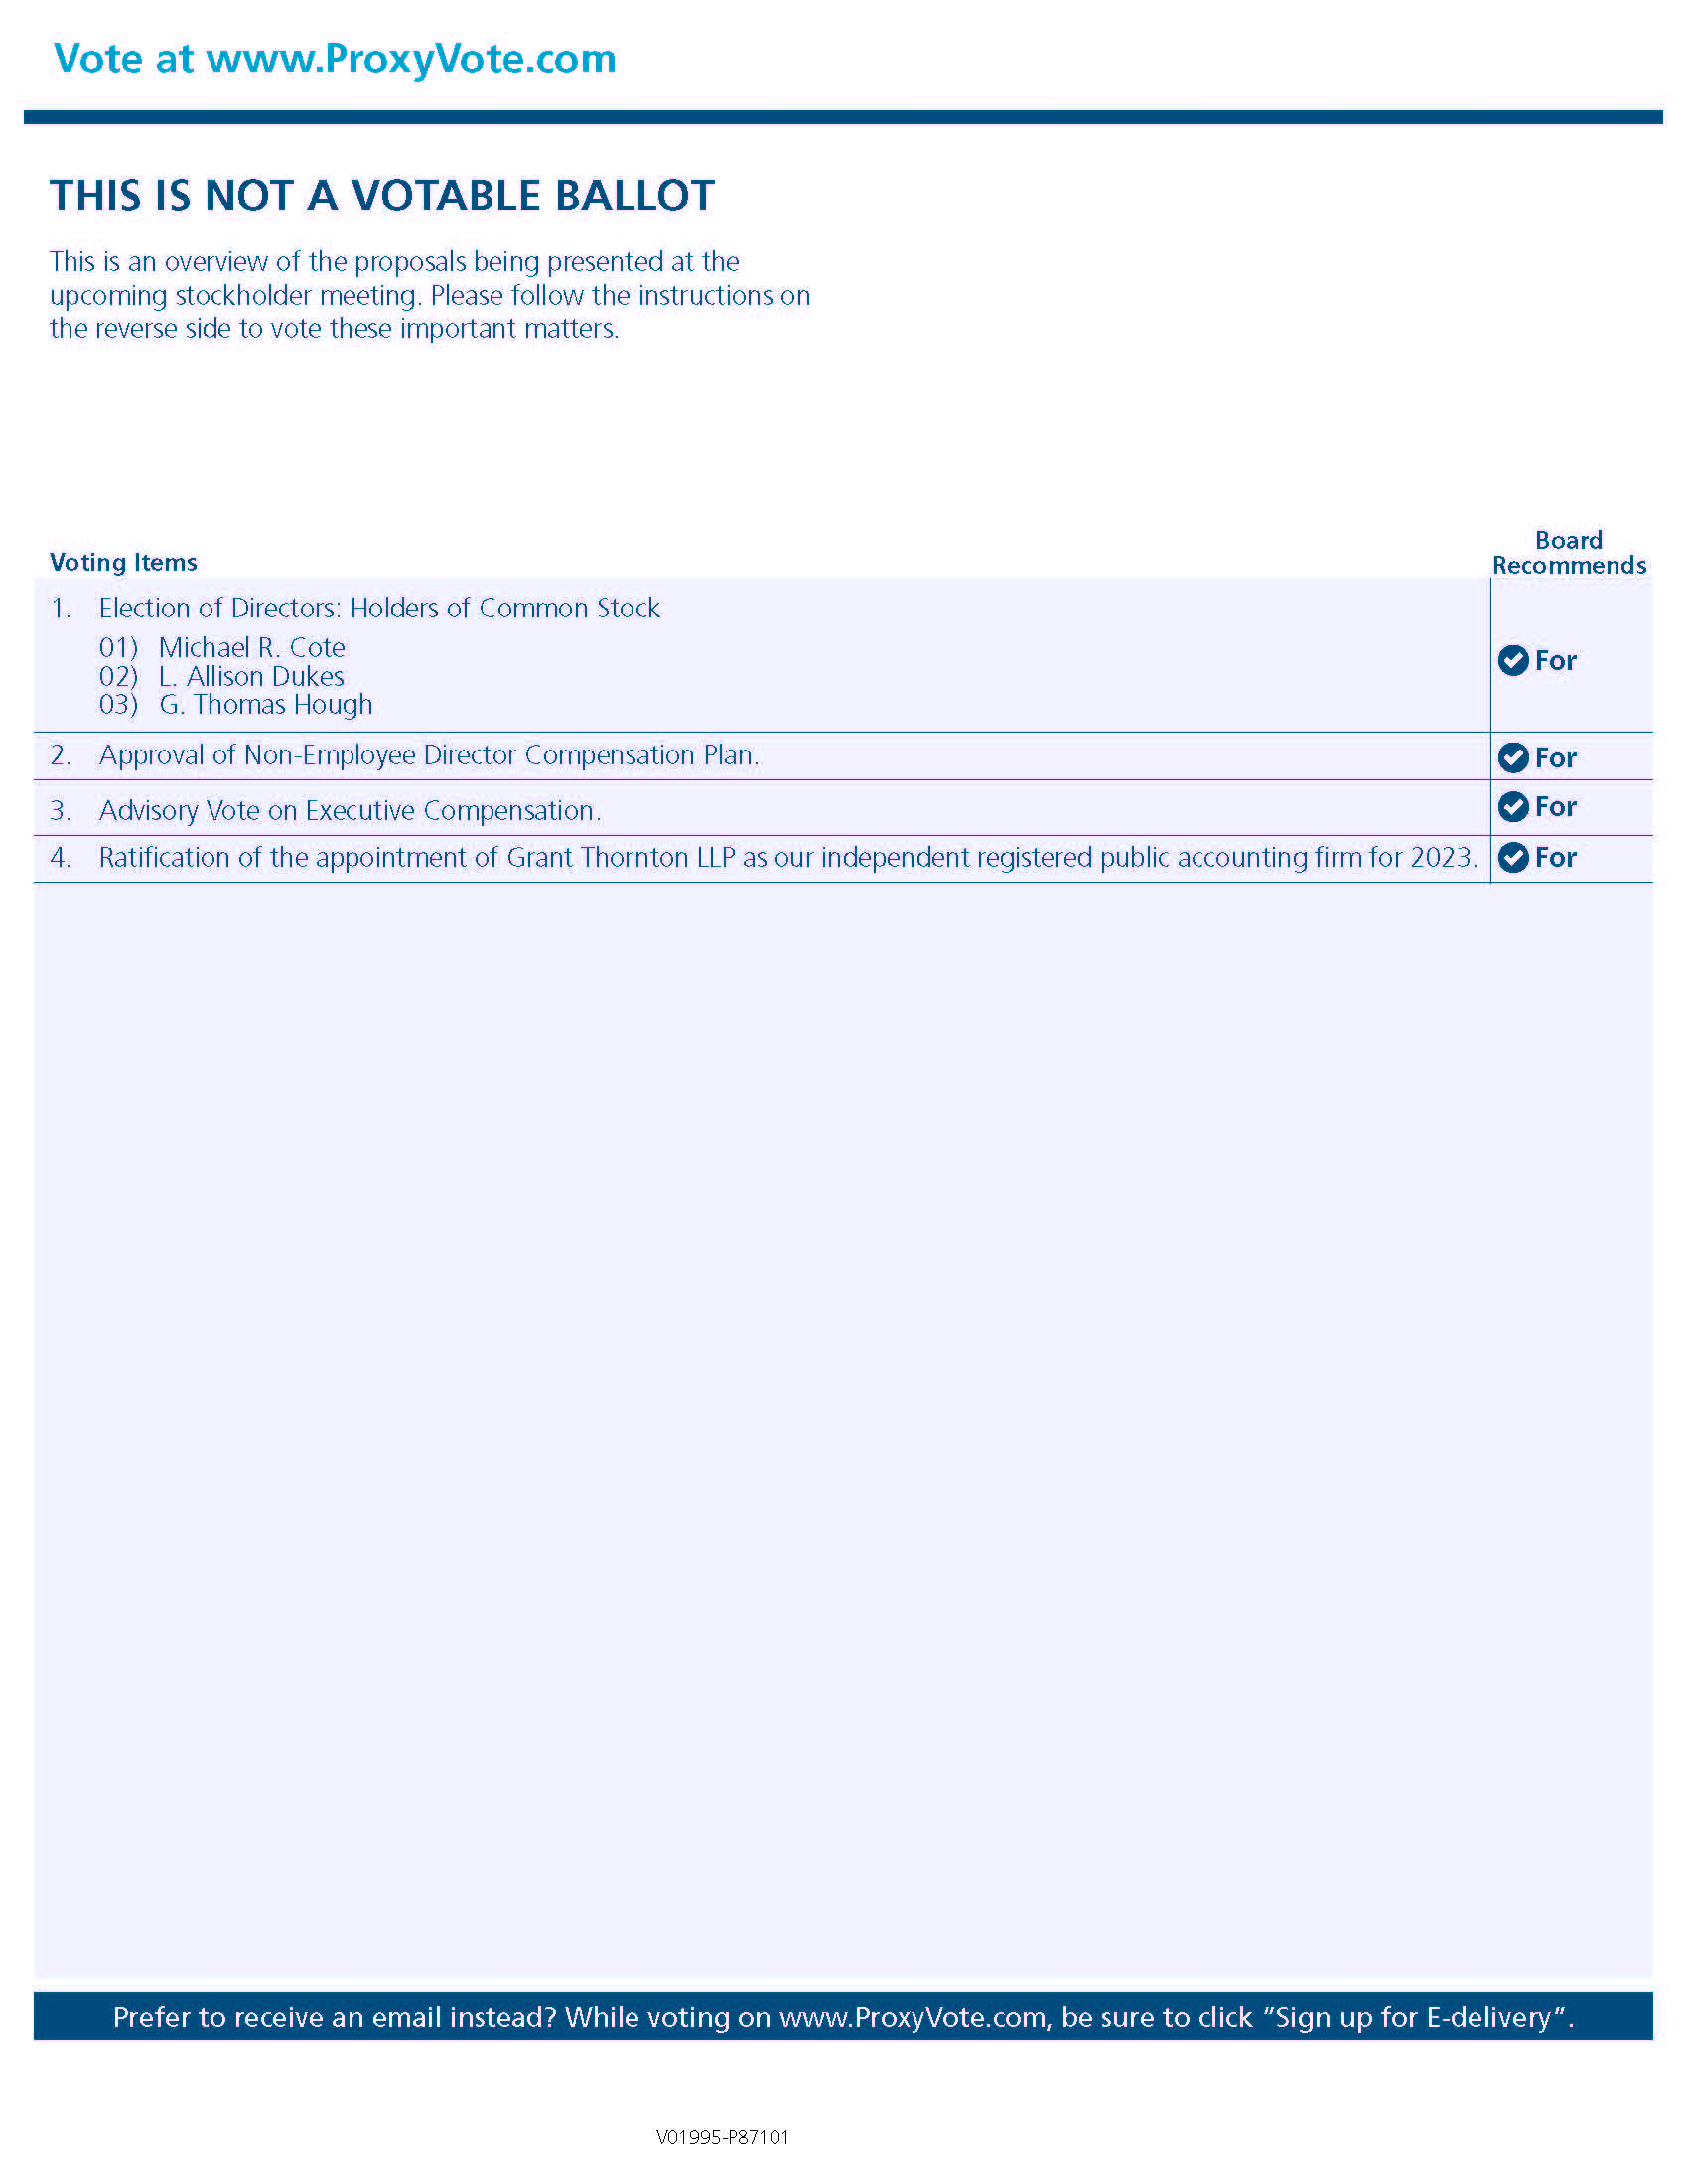
Holders of Common Stock to elect | |
2. | Approval of Non-Employee Director Compensation Plan. 3. Advisory Vote on Executive Compensation 4.Ratification of the appointment of Grant Thornton LLP as our independent |
5. Transact such other business as may properly come before the annual meeting or any adjournments. |

 |  |  |  |  | |
Courtyard Baltimore Downtown/Inner Harbor 1000 Aliceanna Street Baltimore, Maryland 21202 | |||||
RECORD DATE: March 10, 2023 If you are a holder of record of Common Stock or Class A Common Stock at |
Internet: | Telephone Call - 1-800-690-6903* | Vote by mail. Sign, date and return your | ||
*You will need the 11-digit control number included in voting instructions form or notice. | ||||
Annual Meeting of Stockholders to be held on May 8, 2023 The proxy statement and and on |
| TABLE OF CONTENTS | |
| 6 | |
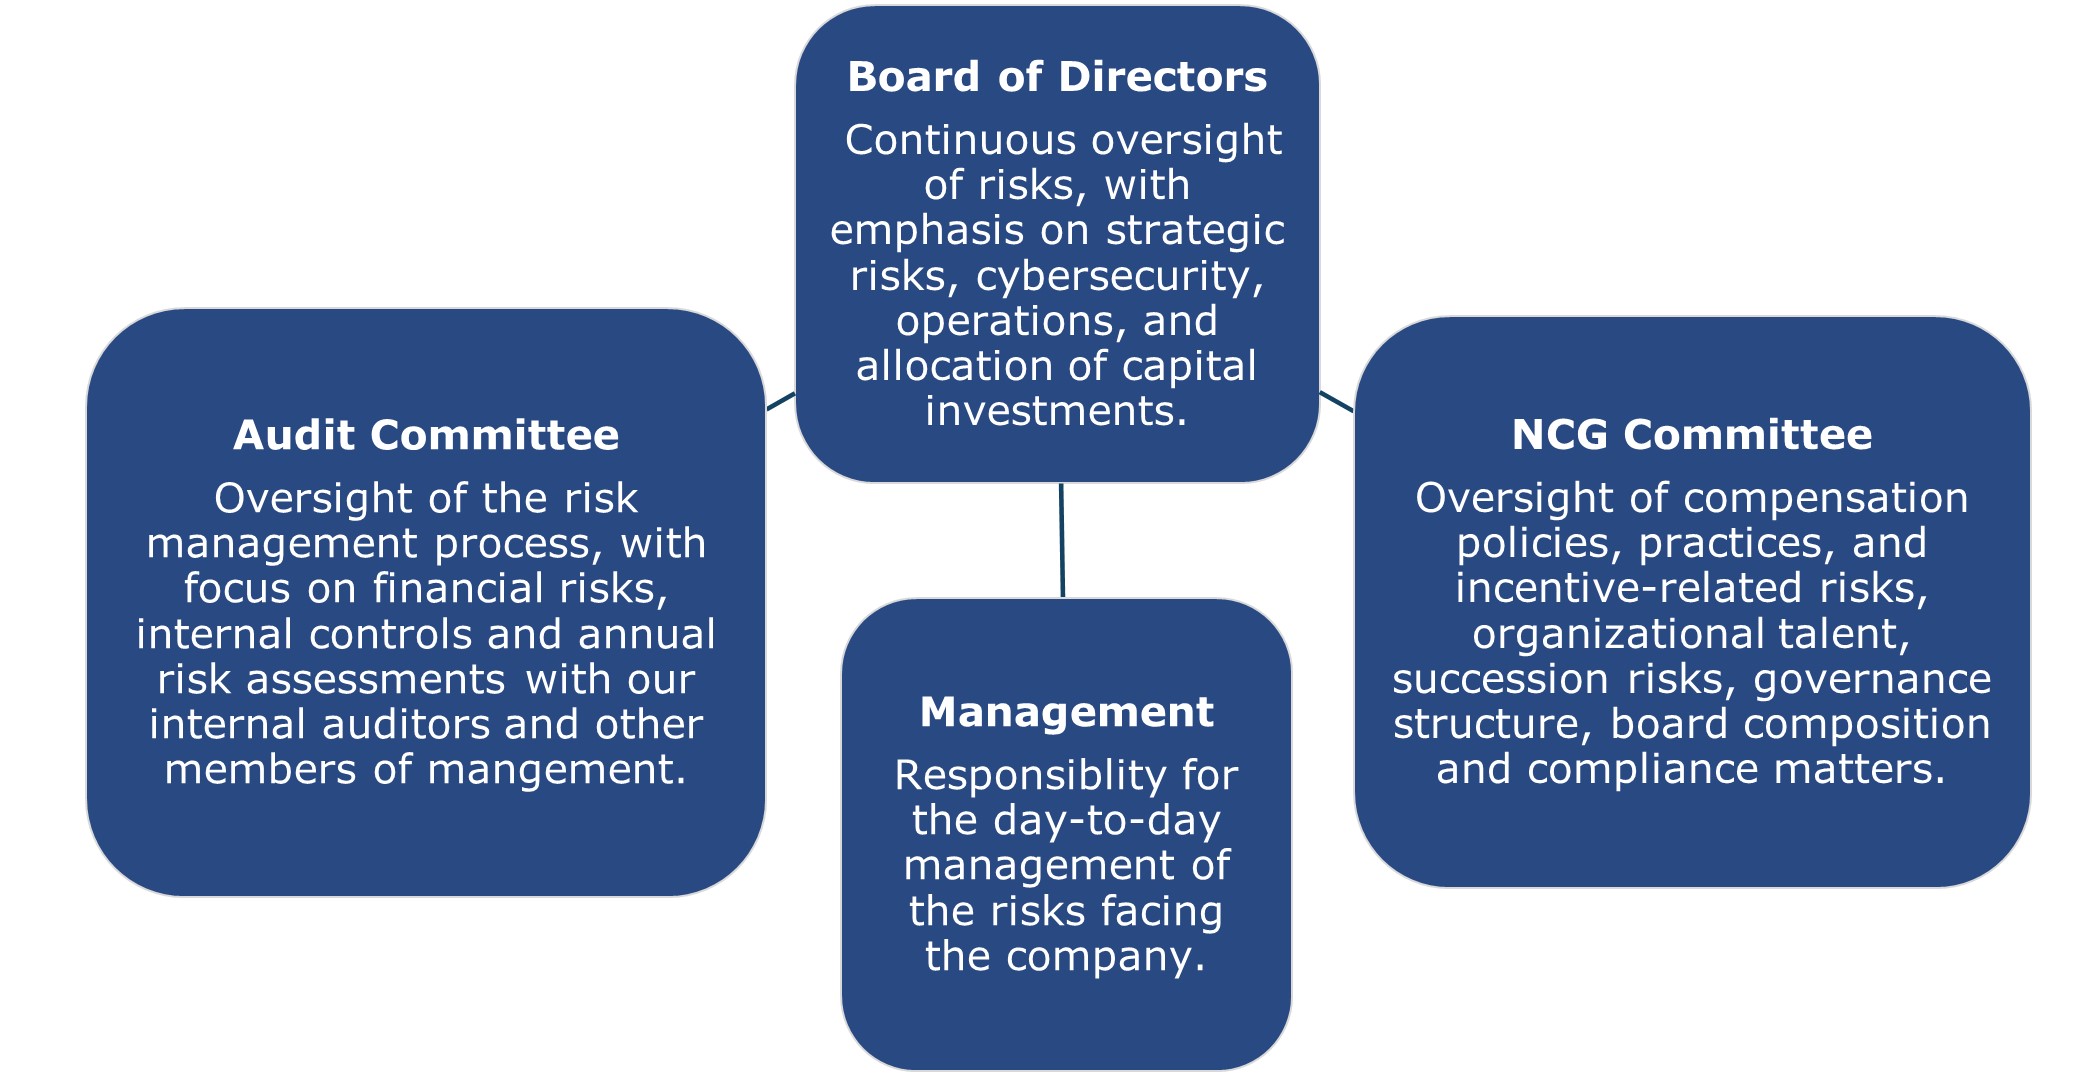
| Board of Directors Oversight Roles | 8 |
| Policies | 9 |
| Director Compensation | 12 |
| Proposal 2: Approval of Non-Employee Director Compensation Plan | 14 |
| Compensation Discussion and Analysis | |
| Role of the NCG Committee | |
| 18 | |
| Executive Compensation Components | 20 |
| Compensation Committee | |
| Executive Compensation | |
| 33 | |
| 36 | |
| Proposal 3: Advisory Vote on Executive Compensation | 41 |
| Equity Compensation Plan Information | |
| Audit Committee Report | 43 |
Public Accounting Firm | 46 |
| Ownership by our Principal Stockholders | 47 |
| Ownership by our Directors and Management | 48 |
| Information about our Annual Meeting | |
| for 2024 Meeting | |
| Non-Employee Director Compensation Plan | Appendix A |
| GAAP to Non-GAAP Reconciliation | Appendix B |
What am I voting on? | ✓Holders of Class A ✓Holders of |
| Voting recommendation: | ✓Our board of directors recommends a vote |
 | |||||||||
 | |||||||||
 | |||||||||
 | |||||||||
 | |||||||||
 | |||||||||
 | |||||||||
 | |||||||||
| Board Matrix |
Class A Common Stock Nominees | Common Stock Nominees | |||||||||
| EXPERIENCE | Haverty | Mangum | Palmer | Schiller | Smith | Trujillo | Cote | Dukes | Hough | |
Current/Former CEO | ✔ | ✔ | ✔ | ✔ | ✔ | |||||
Public Board Experience | ✔ | ✔ | ✔ | ✔ | ✔ | ✔ | ✔ | ✔ | ||
Finance | ✔ | ✔ | ✔ | ✔ | ✔ | ✔ | ✔ | |||
Risk Assessment | ✔ | ✔ | ✔ | ✔ | ✔ | ✔ | ✔ | ✔ | ✔ | |
Consumer Focused | ✔ | ✔ | ✔ | ✔ | ✔ | ✔ | ✔ | |||
Marketing/Brand Building | ✔ | ✔ | ✔ | ✔ | ✔ | |||||
Sales | ✔ | ✔ | ✔ | ✔ | ✔ | ✔ | ||||
| Independent | ✔ | ✔ | ✔ | ✔ | ✔ | ✔ | ✔ | |||
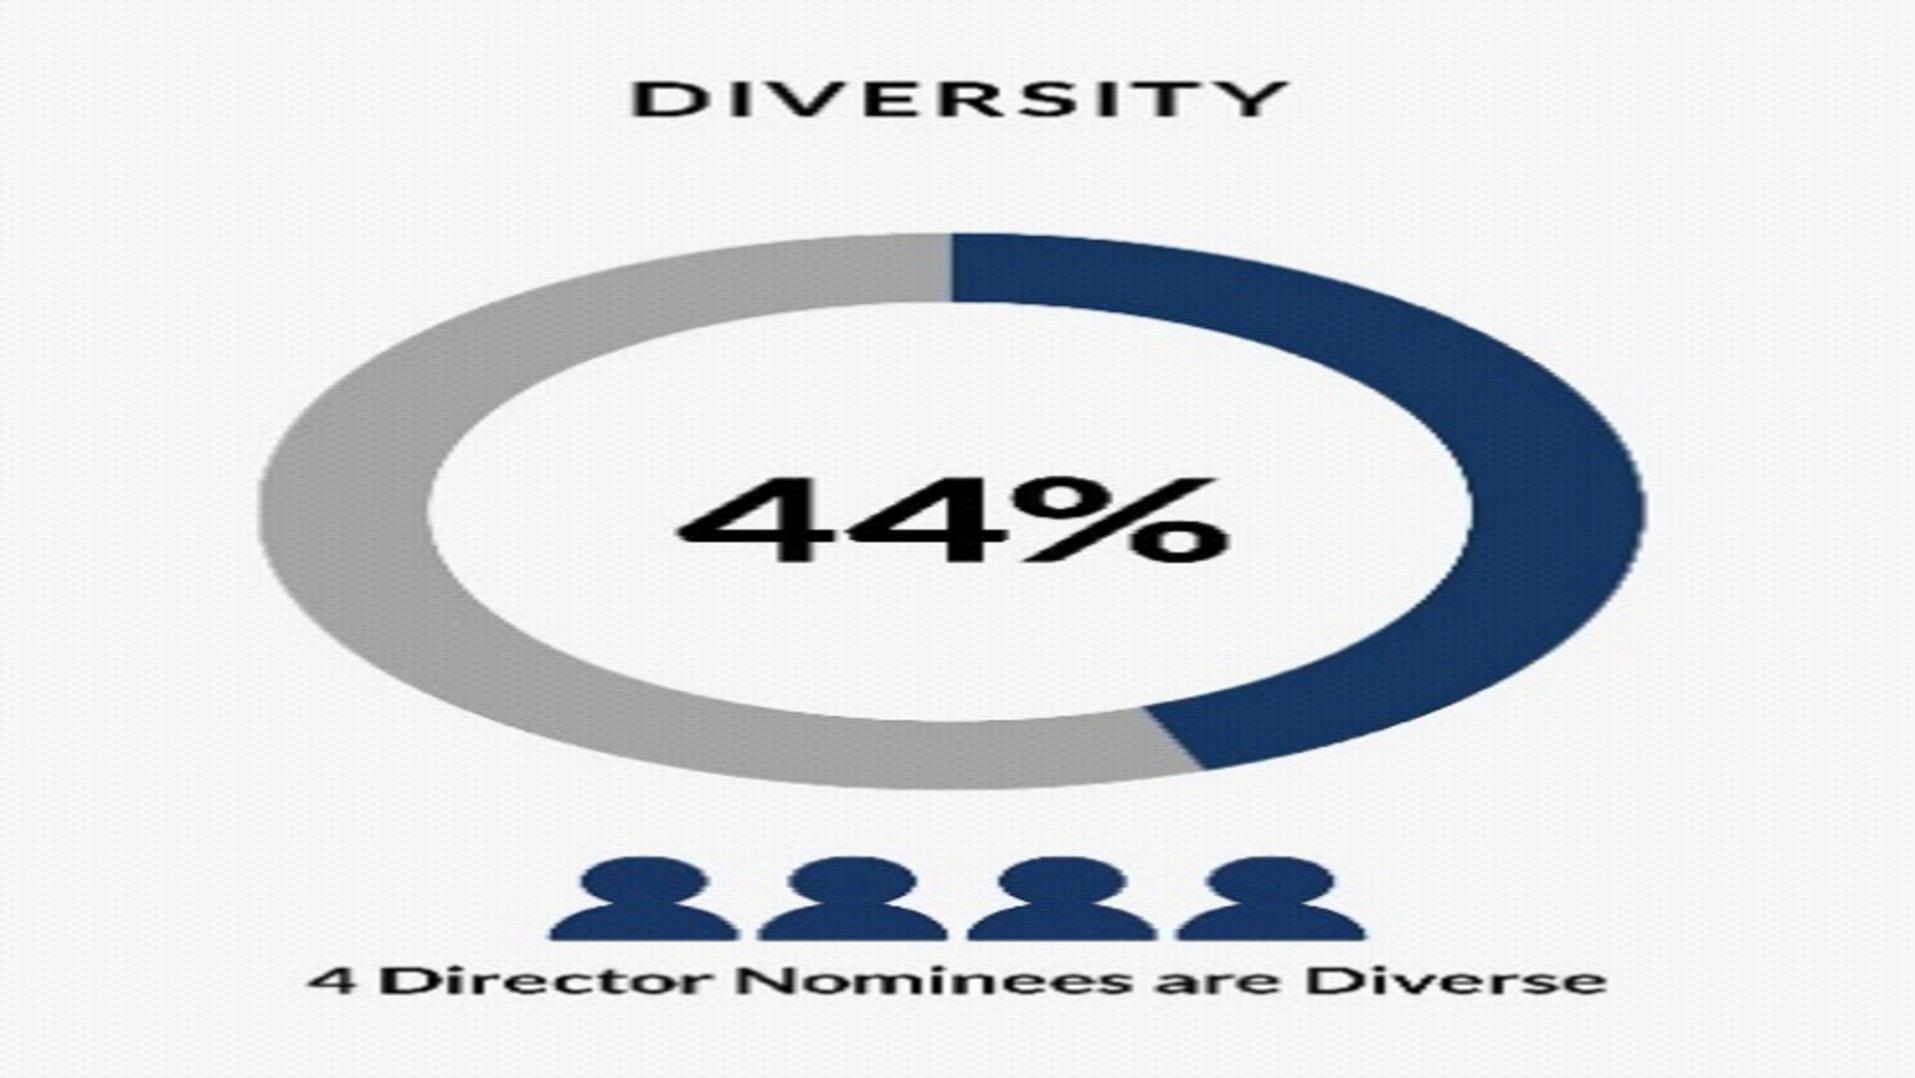
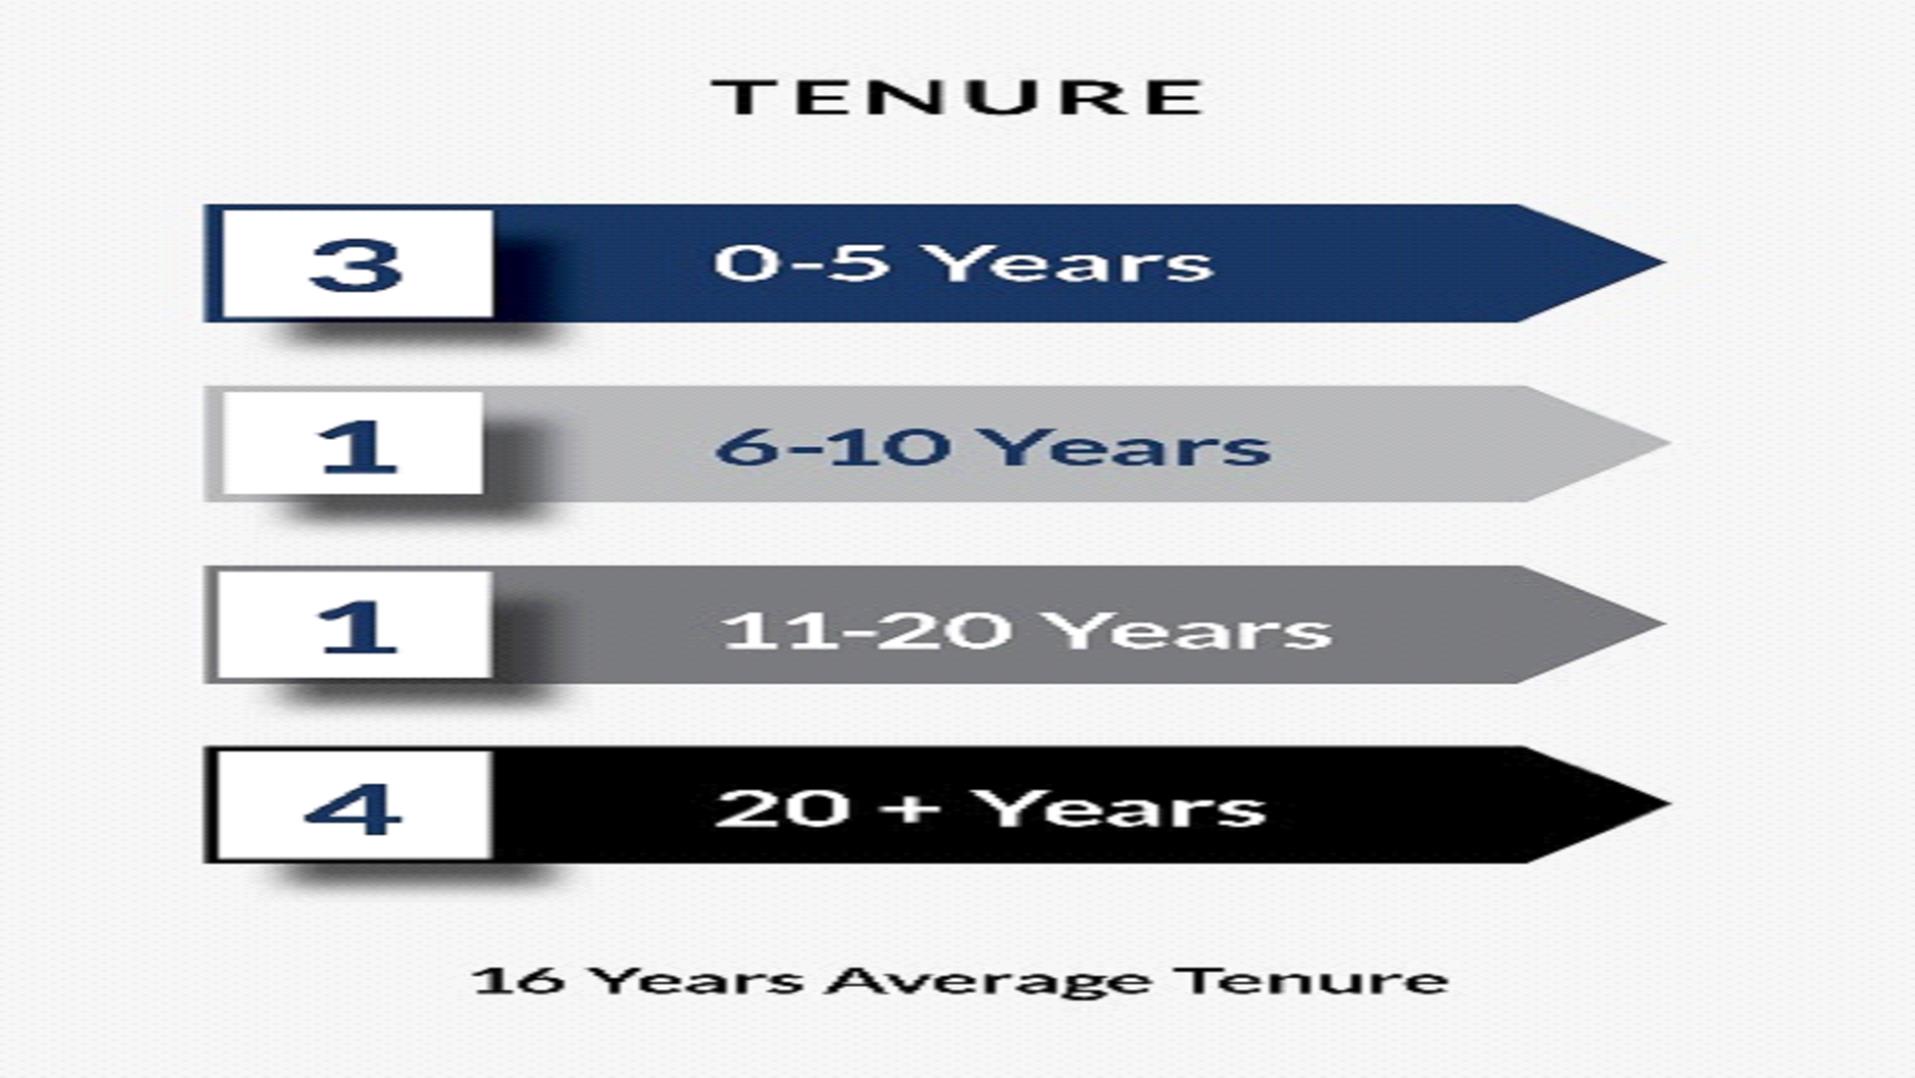
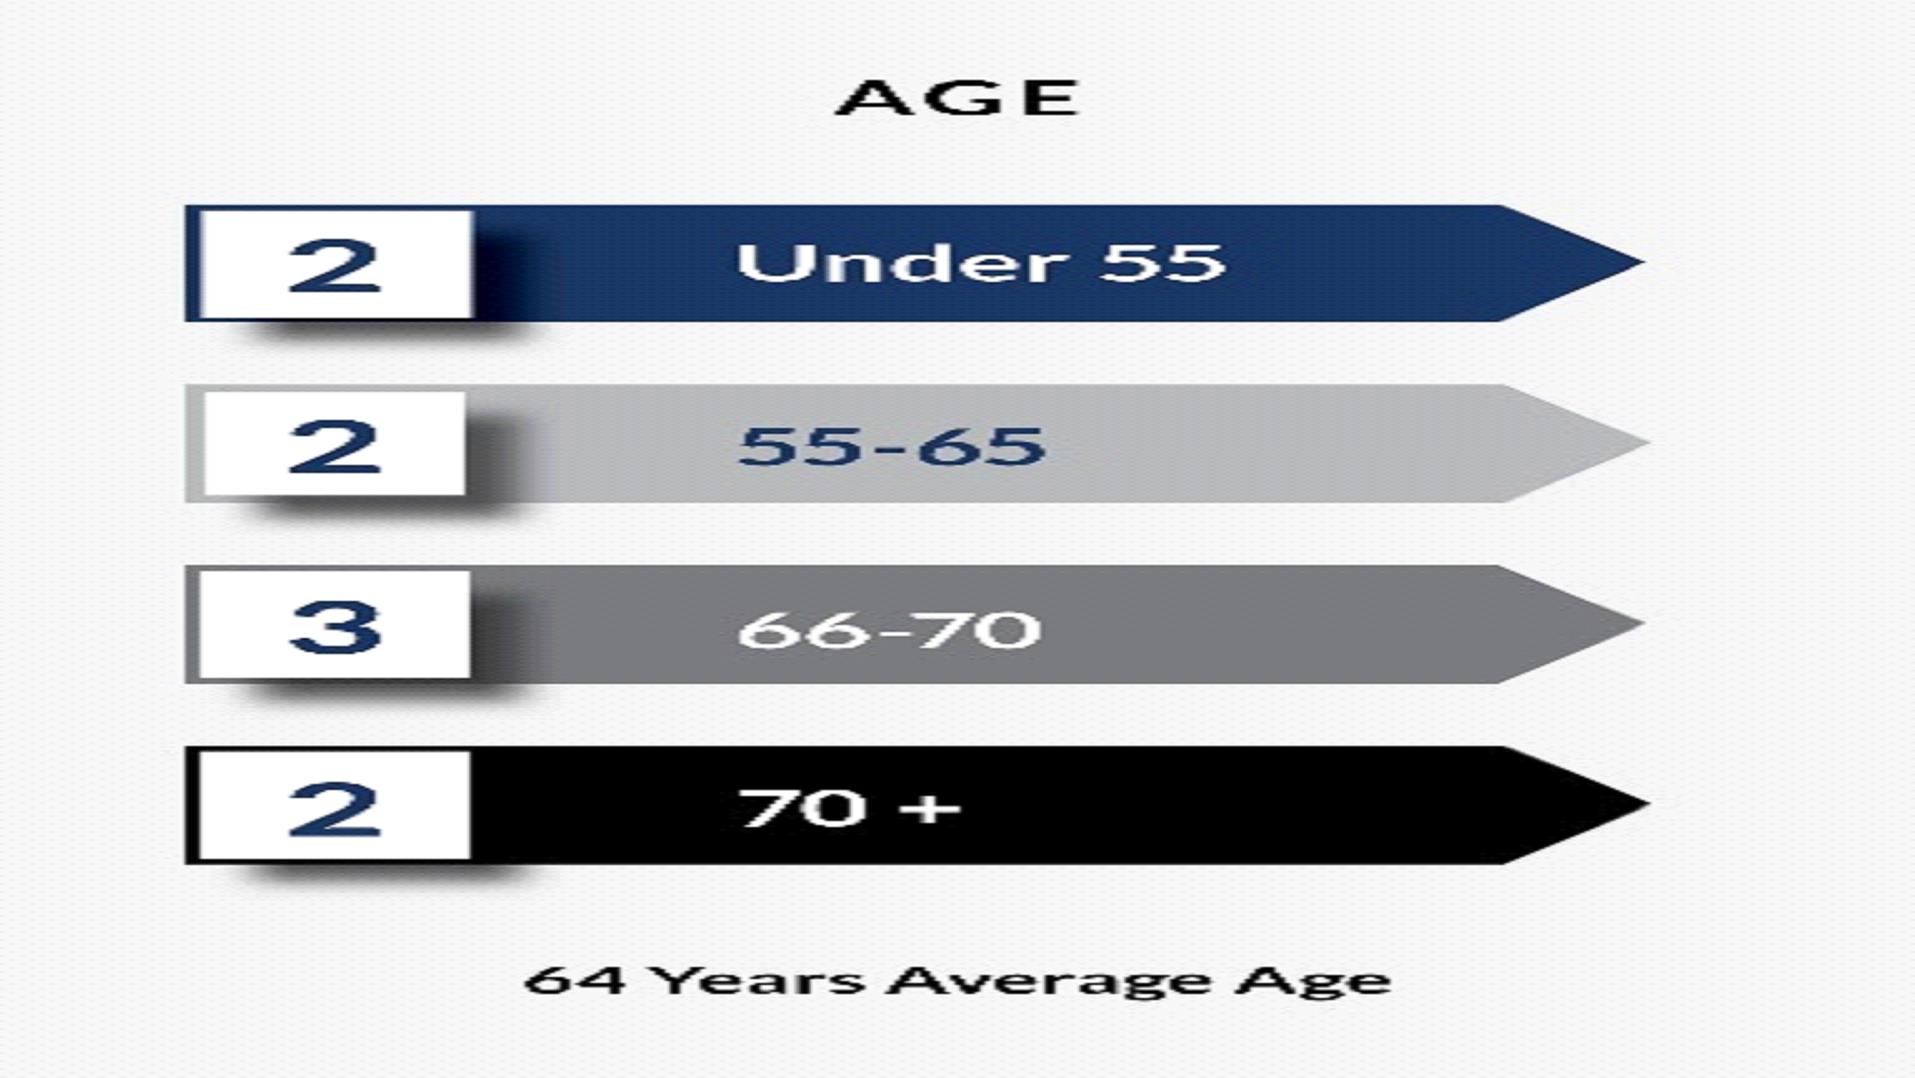
| TENURE/AGE/GENDER/DIVERSITY | ||||||||||
| Years on the Board | 31 | 24 | 21 | 3 | 34 | 19 | 1 | 7 | 5 | |
| Age | 66 | 74 | 69 | 52 | 72 | 63 | 61 | 48 | 68 | |
| Gender | M | F | F | M | M | M | M | F | M | |
| Gender/Race/Ethnicity/Nationality | ✔ | ✔ | ✔ | ✔ | ||||||
| Experience and Skills Legend |
 |  |  |  |  | |  |  | |||
| Current/Former CEO | Public Board Experience | Finance | Risk Assessment | Consumer Focused | Marketing/ Brand Building | Sales |
  | Rawson Haverty, Jr. Age 66 | Non-Independent Non-Executive Director - elect | |
Principal Occupation: Retired     | |||
 | Directorships: Experience:    | ||
  | Mylle H. Mangum Age 74 | Independent Director since 1999 | |
Principal Occupation: Chief Executive Officer of IBT Directorships: Barnes Group, Inc., Express, Inc. Experience: | |||
  | Vicki R. Palmer Age 69 | Independent Director since 2001 | |
Principal Occupation: Retired, former Executive Vice President, Financial Services and Administration for Coca‑Cola Enterprises Inc. from 2004 until 2009. Senior Vice President, Treasurer and Special Assistant to the CEO of Coca-Cola Enterprises Inc. from 1999 to 2004. Directorships: First Horizon National Corporation, Finance Chair of the Black Economic Alliance, member of the Buckhead Coalition, and | |||
| Proposal 1: Nominees for Election by Holders of Class A Common Stock |
 | Derek G. Schiller | Independent Director since 2020 | |
Principal Occupation: President and Chief Executive Officer of the Atlanta Braves, a Major League Baseball Club, since March 2018. President of Business for the Braves from March 2016 to March 2018; Executive Vice President of Sales and Marketing from August 2007 to March 2016 for the Braves. Directorships: Board Member of the Metro Atlanta Chamber of Commerce, the Atlanta Convention and Visitors Bureau, the Atlanta Sports Council, and the Jack and Jill Late-Stage Cancer Foundation. Experience: | |||
  | Clarence H. Smith Age 72 | Management Director since 1989 | |
Principal Occupation: Directorships: Oxford Industries, Inc. and member of the Board of Trustees of Marist School. Experience: | |||
  | Al Trujillo Age 63 | ||
Principal Occupation: President and Chief Operating Officer of the Georgia Tech Foundation since 2013. Investment Funds Advisor from 2007 to 2013. Former President and Chief Executive Officer of Recall Corporation, a global information management company until 2007. Directorships: of Marist School. Former director of SCANA Corporation, which was acquired by Dominion Energy in 2018. Experience: | |||
| Clarence H. Smith and Rawson Haverty, Jr. are first | |||
 | Michael R. Cote Age 61 | Independent Director since 2022 | |
Principal Occupation: Retired, former CEO of Secureworks from 2002 to 2022 and chairman of the board from 2002 to 2011. Directorships: Executive Chairman of the Board of Directors of Nitel, Inc., Member of the Board of Trustees of Children’s Healthcare of Atlanta, Palmetto Technology Group, the board of regents at Boston College, the advisory board of the Georgia Tech School of Cybersecurity and Privacy, and the board of trustees at Marist School. Experience: | |||
  | L. Allison Dukes Age 48 | Independent Director since 2016 | |
Principal Occupation: Senior Managing Director and Chief Financial Officer, Invesco Ltd. since August 2020. Deputy Chief Financial Officer, Invesco Ltd. from March 2020 to August 2020. Former Chief Financial Officer for SunTrust Banks, Inc., from March 2018 until December 2019. Head of Commercial Banking for SunTrust Banks, Inc. from 2017 until 2018. President, Chairman and CEO of the Atlanta Division of SunTrust Banks, Inc. from 2015 until 2017. Directorships: Member of the Experience: | |||
  | G. Thomas Hough Age | ||
 | |
Principal Occupation: Retired, Americas Vice Chair of Ernst & Young LLP (“EY”).Vice Chair of Assurance Services of EY from 2009 to 2014. Directorships: Equifax Inc. and a director/trustee of the | |
Experience:  | |
| Board Leadership |
 | ||||
 |  |  | ||
 | Board | |||
| Name, Meetings and Members | Principal Functions | |
Audit Committee Meetings: 4 Each member has been designated as “an audit committee financial expert” as defined by the Securities and Exchange Commission (“SEC”) and meets the independence requirements of the New York Stock Exchange (“NYSE”), SEC, and our Governance Guidelines as well as the enhanced standards for Audit Committee members in Section 10A-3 of the Securities Exchange Act of 1934, as amended (the “Exchange Act”). |
| CORPORATE GOVERNANCE |
Name, Meetings and Members | Principal Functions | |
NCG Committee Meetings: 2 Actions by Unanimous Consent: 1 Mylle Mangum – Chair Allison Dukes Tom Hough Derek Schiller Al Trujillo Each member | ||
Guidelines as well as the enhanced standards for Compensation Committee | ||
•Reviews and | ||
Executive Committee Meetings: 0 Actions by Unanimous Consent: 1 Independent Members: Management Clarence Smith |
| CORPORATE GOVERNANCE |
| Board of Directors Oversight Roles |
Name | Fees Earned or Paid in Cash ($) | Fees Earned or Paid in Stock ($) | Total ($) | |||||||||
| Allison Dukes | $ | 25,000 | $ | 50,000 | $ | 75,000 | ||||||
| John Glover | 35,000 | 50,000 | 85,000 | |||||||||
Phil Humann(1) | — | 75,000 | 75,000 | |||||||||
| Mylle Mangum | 35,000 | 50,000 | 85,000 | |||||||||
| Vicki Palmer | 25,000 | 50,000 | 75,000 | |||||||||
| Fred Schuermann | 32,500 | 50,000 | 82,500 | |||||||||
| Al Trujillo | 35,000 | 50,000 | 85,000 | |||||||||
| CORPORATE GOVERNANCE |
| Governance Guidelines and Policies |
| CORPORATE GOVERNANCE |
| CORPORATE GOVERNANCE |
| Director Compensation |
| Annual Equity Retainer | $ | 50,000 | ||
| Cash Retainer | $ | 50,000 | ||
| Independent Lead Director Cash Retainer | $ | 12,000 | ||
| Audit and NCG Chairman Cash Retainer | $ | 10,000 | ||
| Annual Stock Grant | $ | 40,000 |
| CORPORATE GOVERNANCE |
| Common Stock | Class A Common Stock | |||||||||||||||||||||||
Shares Beneficially Owned (1) | Acquirable Within 60 Days (2) | Total Beneficial Ownership | Percent of Class(3) | Shares Beneficially Owned | Percent of Class(4) | |||||||||||||||||||
| Steven G. Burdette | 3,657 | 4,583 | 8,240 | * | 28,530 | 1.61 | % | |||||||||||||||||
| J. Edward Clary | 56,091 | 5,872 | 61,963 | * | — | — | ||||||||||||||||||
| L. Allison Dukes | 4,661 | — | 4,661 | * | — | — | ||||||||||||||||||
| Richard D. Gallagher | 12,730 | 4,459 | 17,189 | * | 25,000 | 1.41 | % | |||||||||||||||||
| John T. Glover | 68,108 | — | 68,108 | * | — | — | ||||||||||||||||||
| Richard B. Hare | — | — | — | * | — | — | ||||||||||||||||||
| Rawson Haverty, Jr. | 2,000 | (5) | 2,994 | 4,994 | * | 614,195 | (6)(7)(8) | 34.75 | % | |||||||||||||||
| L. Phillip Humann | 131,391 | — | 131,391 | * | — | — | ||||||||||||||||||
| Mylle H. Mangum | 42,413 | — | 42,413 | * | — | — | ||||||||||||||||||
| Vicki R. Palmer | 37,608 | — | 37,608 | * | — | — | ||||||||||||||||||
| Clarence H. Smith | 75,803 | (9)(10) | 15,965 | 91,768 | * | 692,483 | (11)(12) | 39.18 | % | |||||||||||||||
| Fred L. Schuermann | 31,724 | — | 31,724 | * | — | — | ||||||||||||||||||
| Al Trujillo | 49,307 | — | 49,307 | * | — | — | ||||||||||||||||||
Directors and Executive Officers as a group (16 persons) | 589,489 | 45,732 | 635,221 | 3.26 | % | 1,360,208 | 76.97 | % | ||||||||||||||||
| Director | Fees Earned or Paid in Cash ($) | Stock Awards ($)(1) | Total ($) | |||||||||
Mike Cote(2) | $ | 8,333 | $ | 15,000 | $ | 23,333 | ||||||
| Allison Dukes | 50,000 | 83,333 | 133,333 | |||||||||
| Tom Hough | 62,000 | 83,333 | 145,333 | |||||||||
| Mylle Mangum | 60,000 | 83,333 | 143,333 | |||||||||
| Vicki Palmer | 50,000 | 83,333 | 133,333 | |||||||||
| Derek Schiller | 50,000 | 83,333 | 133,333 | |||||||||
| Al Trujillo | 60,000 | 83,333 | 143,333 | |||||||||
| (1) |
| (2) | |
| PROPOSAL 2: APPROVAL OF NON-EMPLOYEE DIRECTOR COMPENSATION PLAN |
✓ Approval of our Non-Employee Director Compensation Plan. | |
| Voting recommendation: | ✓ Our |
| Common Stock | Class A Common Stock | |||||||||||||
| Name and address of Beneficial Holder | Shares Beneficially Owned | Percent of Class(1) | Shares Beneficially Owned | Percent of Class(2) | ||||||||||
BlackRock, Inc. 55 East 52nd Street, New York, NY | 2,811,047 | (3) | 14.41 | % | — | — | ||||||||
Dimensional Fund Advisors LP 6300 Bee Cave Road, Austin, TX | 1,647,551 | (4) | 8.45 | % | — | — | ||||||||
Renaissance Technologies LLC 800 Third Avenue, New York, NY | 1,430,200 | (5) | 7.33 | % | — | — | ||||||||
The Burton Partnership, LP P.O. Box 4643, Jackson, WY | 1,228,255 | (6) | 6.30 | % | — | — | ||||||||
LSV Asset Management, 155 N. Wacker Drive, Suite 4600, Chicago, IL | 1,053,306 | (7) | 5.40 | % | — | — | ||||||||
The Vanguard Group 100 Vanguard Blvd., Malvern, PA | 996,475 | (8) | 5.11 | % | — | — | ||||||||
Royce & Associates, LLC 745 Fifth Avenue, New York, NY | 994,300 | (9) | 5.10 | % | — | — | ||||||||
Villa Clare Partners, L.P. 158 West Wesley Road, Atlanta, GA | * | * | 603,497 | (10) | 34.15 | % | ||||||||
H5, L.P. 4414 Dunmore Road, NE, Marietta, GA | * | * | 441,323 | (11) | 24.97 | % | ||||||||
Rawson Haverty, Jr. 780 Johnson Ferry Road, NE, Atlanta, GA | * | * | 155,848 | (12)(13) | 8.82 | % | ||||||||
Clarence H. Smith 780 Johnson Ferry Road, NE, Atlanta, GA | * | * | 88,986 | (14) | 5.04 | % | ||||||||
| COMPENSATION DISCUSSION AND ANALYSIS |
| NEO Name | NEO Title | |
| Clarence H. Smith | Chief Executive Officer | |
| Steven G. Burdette | President | |
| Richard B. Hare | Executive Vice President and Chief Financial Officer | |
| J. Edward Clary | Executive Vice President and Chief Information Officer | |
| John L. Gill | Executive Vice President, Merchandising | |
Rawson Haverty, Jr.(1) | Senior Vice President, Real Estate and Development, retired effective March 31, 2023 |
| COMPENSATION DISCUSSION AND ANALYSIS |
| Role of the |
| Conducted an annual review of our compensation philosophy to ensure that it remains appropriate given strategic objectives; | |
| Reviewed results from an annual review of compensation data related to our peers; | |
| Reviewed and approved all compensation components for our chief executive officer, chief financial officer, and other NEOs; | |
| Performed an annual evaluation of the execution of our pay-for-performance philosophy, to ensure that the actual award decisions resulted in alignment of relative pay and relative performance compared to the compensation peer group; | |
| Scheduled an executive session, without members of management, for the purpose of discussing decisions related to the chief executive | |
| Reviewed succession planning with the CEO and in executive session of the board. |
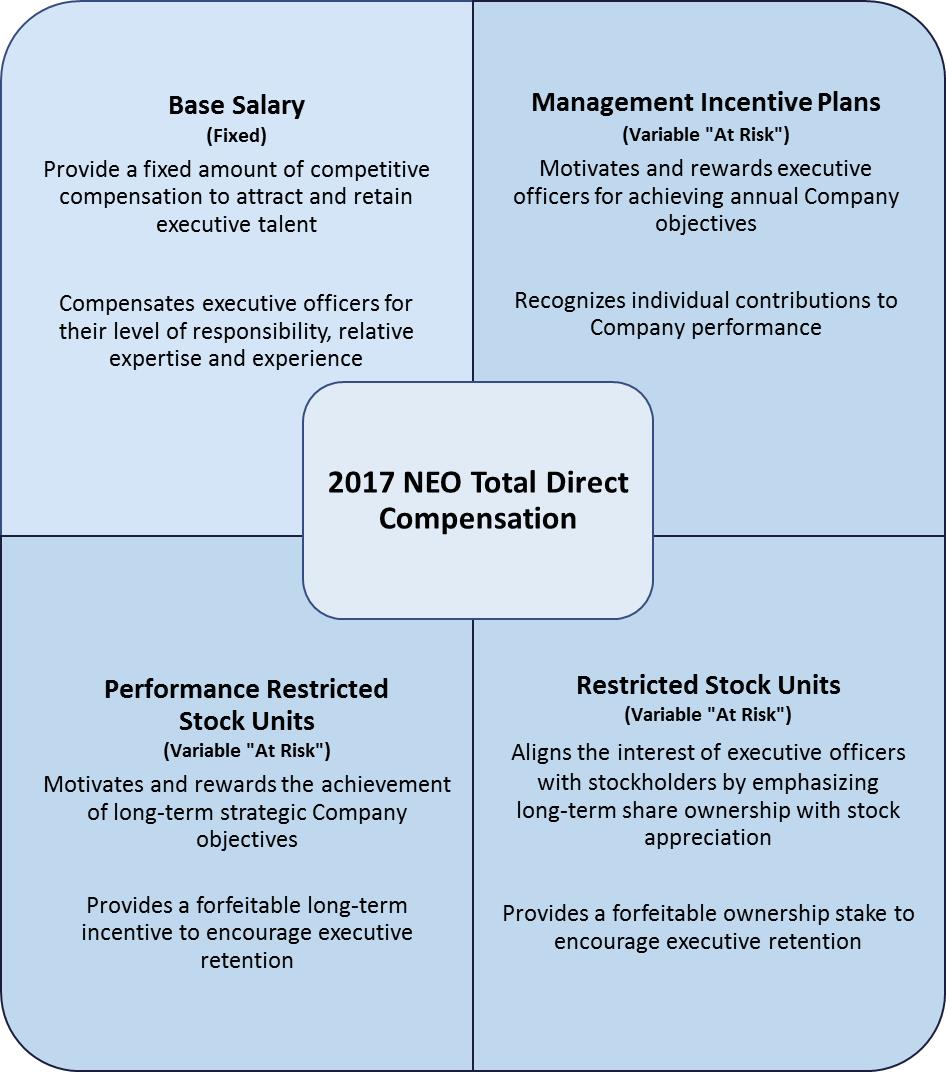
Base Salary (Fixed Pay) | |
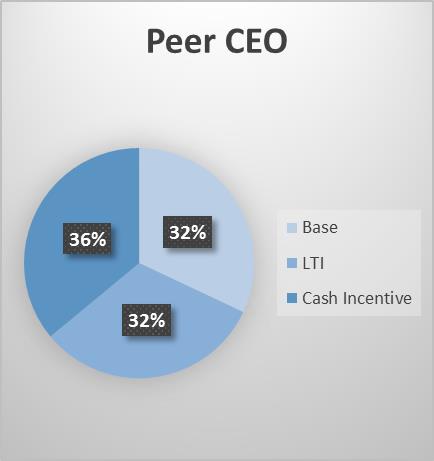
| Key Features | • Fixed annual cash amount. • Base pay increases considered on a calendar year basis or at time of promotion to align with the median range of our peer group (as described on page 18 of this CD&A). Actual positioning varies to reflect each executive’s skills, experience and contribution to our success. |
| Purpose | • Provide a fixed amount of cash compensation to attract and retain talented executives. •Differentiate scope and complexity of executives’ positions as well as individual performance over time. |
| 2022 Actions | • Base salaries were increased in January 2022 by approximately 4.2% for the NEOs. |
Cash Awards Under Management Incentive Plans (Variable “At Risk” Compensation) | |
Key Features | • Individual MIP opportunities are expressed as a percentage of base salary and can vary for executives based on their positions. Target MIP award opportunities are generally established so that total annual cash compensation (base salary plus target MIPs) approximates the median of our peer group. • Performance-based cash incentive pay is comprised of two plans: MIP-I is tied to the company achieving certain pre-tax earnings levels during the year (80% of total target cash incentive pay) and MIP-II is based on successfully meeting individual performance goals (20% of total target cash incentive pay). • The range of potential payout for actual results relative to these goals is zero to 175% of target for MIP‑1 and zero to 100% of target for MIP-II. •MIP amounts are earned based on the results achieved as determined by the Committee after evaluating company and individual performance against pre-established goals. |
| Purpose | •Motivate and reward achieving or exceeding company and individual performance objectives, reinforcing pay-for-performance. • Align performance measures for NEOs on key business objectives to lead the organization to achieve short-term financial and operational goals. •Ensure alignment of short-term and long-term strategies of the company. |
| 2022 Actions | •2022 performance resulted in total MIP-I earned at 108% of its target and MIP-II earned at 93% to 100% of its target for the NEOs. The Committee evaluated the continued impact of the pandemic on our business results and determined that these payouts appropriately reflected our strong performance and financial results achieved during 2022. |
Long-Term Equity Incentive Compensation (Variable “At Risk” Compensation) | |
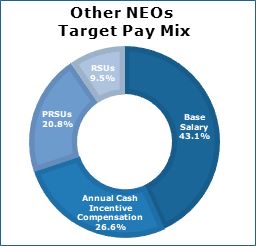
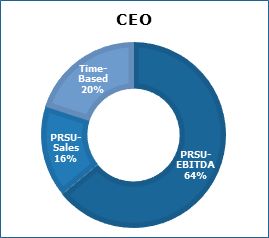
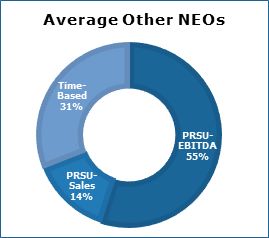
| Key Features | •Awards granted annually with consideration of competitive market grant levels. •Awards to NEOs are in the form of performance restricted stock units (PRSU) based on EBITDA and Sales, each measured over the performance period commencing January 1, 2022 and ending December 31, 2022, and in the form of time-based restricted stock units. •Vesting: The PRSUs granted in 2022 that are earned will cliff vest in February 2025 and are forfeitable upon termination of employment, except in the cases of death, disability or normal retirement. The restricted stock units vest in equal increments over a three-year period. These grants are forfeitable upon termination of employment, except in the cases of death, disability, or normal retirement. |
| Purpose | •Stock-based compensation links executive compensation directly to stockholder interests. •PRSUs provide a direct connection to company performance and executives’ goals. •Multi-year vesting creates a retention mechanism and provides incentives for long-term creation of stockholder value. |
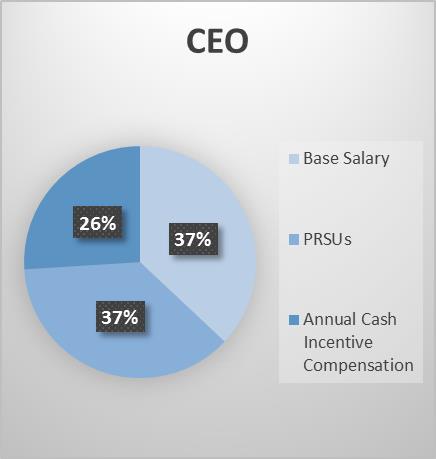
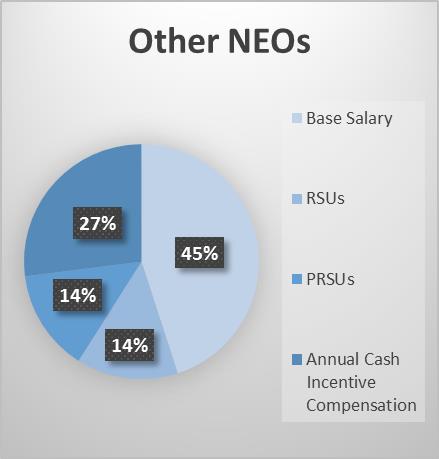
| 2022 Actions | •80% of our CEO’s and 70% of our other NEO’s equity awards were granted as PRSUs, excepting Mr. Haverty at 60%. The PRSUs were tied 80% to EBITDA and 20% tied to Sales. Award sizes were determined in consideration of market levels, internal equity, and historical practices. •2022 performance-based awards tied to EBITDA were earned at 104.3% of target and awards tied to Sales were earned at 101.7% of target. These earned performance-based awards will vest in February 2025. |
| COMPENSATION DISCUSSION AND ANALYSIS |
What We Do: | ||||||||||||||||||||||||||||||||||||||
| ✓ |
| ✓ |
| ✓ |
| ✓ |
| ✓ | |
| ✓ |
| ✓ |
| ✓ |
| ✓ |
| ✓ | |
| x | |
| x |
| x |
| x |
| x | |
| COMPENSATION DISCUSSION AND ANALYSIS |
| MIP-I Goal and Earned | ||||||||||||||||||||||||
| (in millions) | Q1 | Q2 | Q3 | Q4 | Annual | Total | ||||||||||||||||||
| MIP-I Weighting | 8 | % | 10 | % | 10 | % | 12 | % | 60 | % | 100 | % | ||||||||||||
| MIP-I Pre-Tax Earnings Goal | $ | 21.2 | $ | 29.5 | $ | 30.6 | $ | 35.3 | $ | 116.6 | ||||||||||||||
| 2022 Pre-Tax Earnings | $ | 25.7 | $ | 28.7 | $ | 32.6 | $ | 32.5 | $ | 119.5 | ||||||||||||||
| % of Goal Achieved | 121 | % | 97 | % | 107 | % | 92 | % | 102 | % | ||||||||||||||
| Target % Achieved | 163 | % | 94 | % | 121 | % | 84 | % | 106 | % | ||||||||||||||
| % of MIP-I Earned | 13 | % | 9 | % | 12 | % | 10 | % | 64 | % | 108 | % | ||||||||||||
| COMPENSATION DISCUSSION AND ANALYSIS |
| COMPENSATION DISCUSSION AND ANALYSIS |
| How We Make Compensation Decisions |
| COMPENSATION DISCUSSION AND ANALYSIS |
| PEER GROUP | |||||
| American Woodmark Corporation | Ethan Allen Interiors Inc. | La-Z-Boy Incorporated | |||
| At Home Group Inc. | Flexsteel Industries, Inc. | Oxford Industries, Inc. | |||
| Bassett Furniture Industries Inc. | |||||
| Big 5 Sporting Goods Corporation | The Lovesac Company | ||||
| Conn’s, Inc. | |||||
| Culp, Inc. | Knoll, Inc. | ||||
| Stock Ownership Guidelines |
Pre-tax Earnings (in thousands) | ||||||||||||||||||
2015 Achieved(1) | 2016 Achieved | 2017 Goal | 2017 Achieved | |||||||||||||||
| Q-1 | $ | 9,928 | $ | 7,587 | $ | 8,100 | $ | 9,740 | ||||||||||
| Q-2 | 7,027 | 8,762 | 8,400 | 9,694 | ||||||||||||||
| Q-3 | 12,414 | 12,125 | 14,500 | 9,719 | ||||||||||||||
| Q-4 | 15,093 | 17,347 | 16,500 | 14,070 | ||||||||||||||
| YTD | 44,462 | 45,821 | 47,500 | 43,223 | ||||||||||||||
Position | Guidelines | ||
| Chief Executive Officer | 6.0x salary or 135,000 shares | ||
| President | 4.0x salary or 65,000 shares | ||
| Executive Vice President | 3.0x salary or 40,000 shares | ||
| Senior Vice President | 2.0x salary or 25,000 shares |
| Pension Benefits and Retirement Plans |
 | The Committee considered the strong stockholder support of the compensation paid to our NEOs evidenced by the results of this advisory vote, and together with its analysis, did not make any specific changes to our executive compensation program for 2023 in response. Future annual advisory votes on executive compensation will serve as an additional tool to guide the committee in evaluating the alignment of the company’s executive compensation program with |
| Frequency of Say-On-Pay Vote |
The The The Mylle H. Mangum, Chair Derek G. Schiller Al Trujillo |
| Name and Principal Position | Year | Salary | Non-Equity Incentive Plan Compensation (1) | Stock Awards (2) | Change in Pension Value (3) | All Other Compensation (4) | Total | ||||||||||||||||||
| Clarence H. Smith | 2022 | $ | 725,000 | $ | 772,676 | $ | 1,150,562 | $ | — | $ | 30,953 | $ | 2,679,191 | ||||||||||||
CEO(a)(b) | 2021 | 690,000 | 1,104,000 | 1,092,213 | 202,381 | 73,238 | 3,161,832 | ||||||||||||||||||
| 2020 | 601,938 | 954,737 | 816,800 | 17,567 | 45,966 | 2,437,008 | |||||||||||||||||||
| Steven G. Burdette | 2022 | 500,000 | 369,516 | 384,790 | — | 48,544 | 1,302,850 | ||||||||||||||||||
President(a)(b) | 2021 | 462,833 | 494,000 | 510,738 | — | 45,110 | 1,512,681 | ||||||||||||||||||
| 2020 | 365,165 | 341,247 | 278,733 | 56,387 | 29,634 | 1,071,166 | |||||||||||||||||||
| Richard B. Hare | 2022 | 440,000 | 304,807 | 338,614 | — | 25,850 | 1,109,271 | ||||||||||||||||||
EVP and CFO(b) | 2021 | 420,000 | 436,800 | 343,875 | — | 27,537 | 1,228,212 | ||||||||||||||||||
| 2020 | 365,165 | 341,247 | 278,733 | — | 24,228 | 1,009,373 | |||||||||||||||||||
| J. Edward Clary | 2022 | 400,000 | 255,782 | 250,130 | — | 32,422 | 938,334 | ||||||||||||||||||
EVP and CIO(b) | 2021 | 387,000 | 371,520 | 274,609 | — | 28,284 | 1,061,413 | ||||||||||||||||||
| 2020 | 351,088 | 328,122 | 229,725 | 84,039 | 21,955 | 1,014,929 | |||||||||||||||||||
| John L. Gill | 2022 | 400,000 | 255,782 | 250,130 | — | 25,133 | 931,045 | ||||||||||||||||||
EVP, Merchandising(b) | 2021 | 387,000 | 371,520 | 274,609 | — | 25,067 | 1,058,196 | ||||||||||||||||||
| 2020 | 351,088 | 328,122 | 229,725 | 28,502 | 21,692 | 959,129 | |||||||||||||||||||
Rawson Haverty Jr.(c) | 2022 | 350,000 | 184,175 | 185,195 | — | 849,194 | 1,568,564 | ||||||||||||||||||
| SVP, Real Estate | |||||||||||||||||||||||||
| Name | Year | Salary | Non-Equity Incentive Plan Compensation (1) | Stock Awards (2) | Option Awards (2) | Change in Pension Value (3) | All Other Compensation (4) | Total | ||||||||||
| Clarence H. Smith | 2017 | $650,000 | $495,820 | $479,600 | — | $12,992 | $48,880 | $1,687,292 | ||||||||||
| President and CEO | 2016 | 650,000 | 622,388 | 409,708 | — | — | 48,632 | 1,730,728 | ||||||||||
| 2015 | 650,000 | 524,498 | 455,016 | — | 16,870 | 47,746 | 1,694,130 | |||||||||||
Richard B. Hare(5) | 2017 | 242,644 | 172,228 | 221,998 | — | — | 31,089 | 667,959 | ||||||||||
| EVP and CFO | ||||||||||||||||||
Dennis L. Fink(6) | 2017 | 261,255 | 87,029 | — | — | 40,180 | 61,666 | 450,130 | ||||||||||
| EVP, Finance | 2016 | 390,000 | 242,731 | 210,710 | — | 15,969 | 29,862 | 889,272 | ||||||||||
| 2015 | 390,000 | 220,271 | 234,000 | — | 18,296 | 30,316 | 892,883 | |||||||||||
| Steven G. Burdette | 2017 | 370,000 | 153,802 | 228,900 | — | 38,281 | 27,953 | 818,936 | ||||||||||
| EVP, Operations | 2016 | 370,000 | 211,237 | 199,919 | — | 17,670 | 27,281 | 826,107 | ||||||||||
| 2015 | 370,000 | 204,000 | 222,000 | — | — | 25,954 | 821,954 | |||||||||||
| Richard D. Gallagher | 2017 | 360,000 | 144,461 | 228,900 | — | 51,424 | 29,879 | 814,664 | ||||||||||
| EVP, Merchandise | 2016 | 360,000 | 205,528 | 194,505 | — | 23,971 | 29,705 | 813,709 | ||||||||||
| 2015 | 360,000 | 204,535 | 216,000 | — | — | 25,293 | 805,828 | |||||||||||
| J. Edward Clary | 2017 | 355,000 | 156,796 | 218,000 | — | 57,930 | 27,141 | 814,867 | ||||||||||
| EVP and CIO | 2016 | 355,000 | 206,082 | 191,798 | — | 26,982 | 27,637 | 807,499 | ||||||||||
| 2015 | 346,670 | 199,564 | 207,024 | — | — | 26,795 | 780,053 |
| (a) | Mr. Smith served as President and CEO and Mr. Burdette served as EVP, Operations during 2020. Mr. Burdette was promoted to President on March 1, 2021, and his 2021 base salary was increased from $402,000 to $475,000. |
| (b) | Mr. Smith’s salary was reduced 40% and the salaries of the other NEOs were reduced 25% on April 1, 2020 as part of the company’s business continuity plan. The salaries were reinstated on July 1, 2020 based on the company’s performance upon reopening of stores in May 2020. |
| (c) | Mr. Haverty announced his retirement in 2022, effective March 31, 2023. In connection with his pending retirement the NCG Committee and Mr. Haverty agreed to cancel his outstanding grants on November 21, 2022 in exchange for $803,886. Mr. Haverty is deemed an NEO in 2022 due to the inclusion of this payment in his 2022 compensation. |
| Summary Compensation Table Footnotes |
| (1) | Non-Equity Incentive Plan Compensation: Amounts for the cash earned |
Corporate Performance ($) | Individual Performance ($) | Total Annual Incentive Award ($) | ||||||||||
| Smith | $ | 627,676 | $ | 145,000 | $ | 772,676 | ||||||
| Burdette | 303,016 | 66,500 | 369,516 | |||||||||
| Hare | 247,607 | 57,200 | 304,807 | |||||||||
| Clary | 207,782 | 48,000 | 255,782 | |||||||||
| Gill | 207,782 | 48,000 | 255,782 | |||||||||
| Haverty | 151,508 | 32,667 | 184,175 | |||||||||
| EXECUTIVE COMPENSATION |
| (2) | Stock Awards:These amounts The table below sets forth the details of the components that make up the 2022 equity awards. The value of the performance shares shown as earned was calculated using the number of shares earned under the EBITDA grant multiplied by the share price on the date of grant. The EBITDA and Sales performance grants were earned at the maximum thresholds. |
| Components of Annual Stock Awards | Additional Information | |||||||||||||||||||||||
Value of Time-based shares ($) | Value of Performance Shares - Target ($) | Total | Value of Performance Shares – at Maximum | |||||||||||||||||||||
| EBITDA | Sales | EBITDA | Sales | |||||||||||||||||||||
| Smith | $ | 230,101 | $ | 736,363 | $ | 184,098 | $ | 1,150,562 | $ | 1,288,635 | $ | 230,122 | ||||||||||||
| Burdette | 115,440 | 215,469 | 53,882 | 384,790 | 377,070 | 67,352 | ||||||||||||||||||
| Hare | 101,587 | 189,610 | 47,417 | 338,614 | 331,818 | 59,275 | ||||||||||||||||||
| Clary | 75,036 | 140,086 | 35,007 | 250,130 | 245,151 | 43,759 | ||||||||||||||||||
| Gill | 75,036 | 140,086 | 35,007 | 250,130 | 245,151 | 43,759 | ||||||||||||||||||
| Haverty | 74,084 | 88,889 | 22,222 | 185,195 | 155,555 | 27,778 | ||||||||||||||||||
| (3) | Change in Pension Value: Represents the aggregate |
| (4) | All Other Compensation:These amounts for 2022 are comprised of |
401(k) Plan Match(a) | Deferred Compensation Plan Contribution(b) | Other(c) | Stock Award Cancellation | Total | ||||||||||||||||
| Smith | $ | 12,200 | $ | — | $ | 18,753 | $ | — | $ | 30,953 | ||||||||||
| Burdette | 12,200 | 20,670 | 15,674 | — | 48,544 | |||||||||||||||
| Hare | 12,200 | — | 13,650 | — | 25,850 | |||||||||||||||
| Clary | 12,200 | 4,000 | 16,222 | — | 32,422 | |||||||||||||||
| Gill | 12,200 | — | 12,933 | — | 25,133 | |||||||||||||||
| Haverty | 12,200 | 17,500 | 15,608 | 803,886 | 849,194 | |||||||||||||||
| (a) | The maximum 401(k) match for calendar year 2022 was $12,200. |
| (b) | Company contributions to the Deferred Compensation Plan |
| (c) | Includes: premium costs for covering a portion of medical insurance coverage, additional life insurance, long-term disability coverage and health examinations. |
| (d) | Mr. Haverty announced his retirement in 2022, effective March 31, 2023. In connection with his pending retirement the NCG Committee and Mr. Haverty agreed to cancel his outstanding grants on November 21, 2022 in exchange for $803,886. |
Estimated Possible Payouts Under Non-Equity Incentive Plan Awards ($)(2) | Estimated Possible Payouts Under Equity Incentive Plan Awards (#)(3)(4) | |||||||||||||||||||||||||||||||||||||
| Name | Award Type(1) | Grant and NCG Committee Approval Date | Threshold | Target | Maximum | Threshold | Target | Maximum | All Other Stock Awards: Number of Shares of Stock (#) | Exercise or Base Price of Awards $/Share(5) | Grant Date Fair Value of Stock Award $(6) | |||||||||||||||||||||||||||
| Smith | ACMIP-I | 1/26/2022 | 18,560 | 580,000 | 1,015,000 | — | — | — | — | — | — | |||||||||||||||||||||||||||
| ACMIP-II | 1/26/2022 | — | 145,000 | 145,000 | — | — | — | — | — | — | ||||||||||||||||||||||||||||
| PRSU | 1/26/2022 | — | — | — | 10,206 | 25,515 | 44,651 | — | $ | 28.86 | $ | 736,363 | ||||||||||||||||||||||||||
| PRSU.1 | 1/26/2022 | — | — | — | 2,552 | 6,379 | 7,974 | — | 28.86 | 184,098 | ||||||||||||||||||||||||||||
| RSU | 1/26/2022 | — | — | — | — | — | — | 7,973 | 28.86 | 230,101 | ||||||||||||||||||||||||||||
| Burdette | ACMIP-I | 1/26/2022 | 8,960 | 280,000 | 490,000 | — | — | — | — | — | — | |||||||||||||||||||||||||||
| ACMIP-II | 1/26/2022 | — | 70,000 | 70,000 | — | — | — | — | — | — | ||||||||||||||||||||||||||||
| PRSU | 1/26/2022 | — | — | — | 2,986 | 7,466 | 13,066 | — | 28.86 | 215,469 | ||||||||||||||||||||||||||||
| PRSU.1 | 1/26/2022 | — | — | — | 747 | 1,867 | 2,334 | — | 28.86 | 53,882 | ||||||||||||||||||||||||||||
| RSU | 1/26/2022 | — | — | — | — | — | — | 4,000 | 28.86 | 115,440 | ||||||||||||||||||||||||||||
| Hare | ACMIP-I | 1/26/2022 | 7,322 | 228,800 | 400,400 | — | — | — | — | — | — | |||||||||||||||||||||||||||
| ACMIP-II | 1/26/2022 | — | 57,200 | 57,200 | — | — | — | — | — | — | ||||||||||||||||||||||||||||
| PRSU | 1/26/2022 | — | — | — | 2,628 | 6,570 | 11,498 | — | 28.86 | 189,610 | ||||||||||||||||||||||||||||
| PRSU.1 | 1/26/2022 | — | — | — | 657 | 1,643 | 2,054 | — | 28.86 | 47,417 | ||||||||||||||||||||||||||||
| RSU | 1/26/2022 | — | — | — | — | — | — | 3,520 | 28.86 | 101,587 | ||||||||||||||||||||||||||||
| Clary | ACMIP-I | 1/26/2022 | 6,144 | 192,000 | 336,000 | — | — | — | — | — | — | |||||||||||||||||||||||||||
| ACMIP-II | 1/26/2022 | — | 48,000 | 48,000 | — | — | — | — | — | — | ||||||||||||||||||||||||||||
| PRSU | 1/26/2022 | — | — | — | 1,942 | 4,854 | 8,495 | — | 28.86 | 140,086 | ||||||||||||||||||||||||||||
| PRSU.1 | 1/26/2022 | — | — | — | 485 | 1,213 | 1,516 | — | 28.86 | 35,007 | ||||||||||||||||||||||||||||
| RSU | 1/26/2022 | — | — | — | — | — | — | 2,600 | 28.86 | 75,036 | ||||||||||||||||||||||||||||
| Gill | ACMIP-I | 1/26/2022 | 6,144 | 192,000 | 336,000 | — | — | — | — | — | — | |||||||||||||||||||||||||||
| ACMIP-II | 1/26/2022 | — | 48,000 | 48,000 | — | — | — | — | — | — | ||||||||||||||||||||||||||||
| PRSU | 1/26/2022 | — | — | — | 1,942 | 4,854 | 8,495 | — | 28.86 | 140,086 | ||||||||||||||||||||||||||||
| PRSU.1 | 1/26/2022 | — | — | — | 485 | 1,213 | 1,516 | — | 28.86 | 35,007 | ||||||||||||||||||||||||||||
| RSU | 1/26/2022 | — | — | — | — | — | — | 2,600 | 28.86 | 75,036 | ||||||||||||||||||||||||||||
| Haverty | ACMIP-I | 1/26/2022 | 4,480 | 140,000 | 245,000 | — | — | — | — | — | — | |||||||||||||||||||||||||||
| ACMIP-II | 1/26/2022 | — | 35,000 | 35,000 | — | — | — | — | — | — | ||||||||||||||||||||||||||||
| PRSU | 1/26/2022 | — | — | — | 1,232 | 3,080 | 5,390 | — | 28.86 | 88,889 | ||||||||||||||||||||||||||||
| PRSU.1 | 1/26/2022 | — | — | — | 308 | 770 | 963 | — | 28.86 | 22,222 | ||||||||||||||||||||||||||||
| RSU | 1/26/2022 | — | — | — | — | — | — | 2,567 | 28.86 | 74,084 | ||||||||||||||||||||||||||||
| Name | Award Type(1) | Grant and Compensation Committee Approval Date | Estimated Possible Payouts Under Non-Equity Incentive Plan Awards ($)(2) | Estimated Possible Payouts Under Equity Incentive Plan Awards (#)(3)(4) | All Other Stock Awards: Number of Shares of Stock (#) | Exercise or Base Price of Awards $/Share(5) | Grant Date Fair Value of Stock Award $(6) | |||||||||||
| Threshold | Target | Maximum | Threshold | Target | Maximum | |||||||||||||
| Smith | ACMIP-I | 1/30/2017 | $14,560 | $520,000 | $910,000 | — | — | — | — | — | — | |||||||
| ACMIP-II | 1/30/2017 | 26,000 | 130,000 | 130,000 | — | — | — | — | — | — | ||||||||
| PRSU | 1/30/2017 | — | — | — | 9,240 | 15,400 | 24,640 | — | $ 21.80 | $335,720 | ||||||||
| PRSU.1 | 1/30/2017 | — | — | — | 0 | 6,600 | 6,600 | — | 21.80 | 143,880 | ||||||||
| Hare | ACMIP-I | 05/04/2017 | 4,973 | 177,600 | 310,800 | — | — | — | — | — | — | |||||||
| ACMIP-II | 05/04/2017 | 11,100 | 44,400 | 44,400 | — | — | — | — | — | — | ||||||||
| PRSU | 05/04/2017 | — | — | — | 2,638 | 4,396 | 7,034 | — | (2) | 25.25 | 110,999 | |||||||
| RSU | 05/04/2017 | — | — | — | — | — | — | 4,396 | 25.25 | 110,999 | ||||||||
| Fink | ACMIP-I | 05/09/2017 | 10,483 | 26,208 | 45,864 | — | — | — | — | — | — | |||||||
| ACMIP-II | 05/09/2017 | 46,800 | 46,800 | 46,800 | — | — | — | — | — | — | ||||||||
| Burdette | ACMIP-I | 1/30/2017 | 4,973 | 177,600 | 310,800 | — | — | — | — | — | — | |||||||
| ACMIP-II | 1/30/2017 | 2,220 | 44,400 | 44,400 | — | — | — | — | — | — | ||||||||
| PRSU | 1/30/2017 | — | — | — | 3,150 | 5,250 | 8,400 | — | 21.80 | 114,450 | ||||||||
| RSU | 1/30/2017 | — | — | — | — | — | — | 5,250 | 21.80 | 114,450 | ||||||||
| Gallagher | ACMIP-I | 1/30/2017 | 4,838 | 172,800 | 302,400 | — | — | — | — | — | — | |||||||
| ACMIP-II | 1/30/2017 | 4,320 | 43,200 | 43,200 | — | — | — | — | — | — | ||||||||
| PRSU | 1/30/2017 | — | — | — | 3,150 | 5,250 | 8,400 | — | 21.80 | 114,450 | ||||||||
| RSU | 1/30/2017 | — | — | — | — | — | — | 21.80 | 114,450 | |||||||||
| Clary | ACMIP-I | 1/30/2017 | 4,771 | 170,400 | 298,200 | — | — | — | — | — | — | |||||||
| ACMIP-II | 1/30/2017 | 4,260 | 42,600 | 42,600 | — | — | — | — | — | — | ||||||||
| PRSU | 1/30/2017 | — | — | — | 3,000 | 5,000 | 8,000 | — | 21.80 | 109,000 | ||||||||
| RSU | 1/30/2017 | — | — | — | — | — | — | 5,000 | 21.80 | 109,000 | ||||||||
| (1) | Award Type: | ACMIP-I = Annual Cash Management Incentive Plan Compensation based on company performance ACMIP-II = Annual Cash Management Incentive Plan Compensation based on individual performance PRSU = Performance Restricted Stock Units contingent - EBITDA PRSU.1 = Performance Restricted Stock Units contingent - Sales RSU = Restricted Stock Unit |
| (2) | The | |
| (3) | The PRSU | |
| (4) | The PRSU.1 | |
| (5) | The base price for the PRSUs and RSUs is the closing price of our stock on the date of grant. | |
| (6) | The fair value for the PRSUs and RSUs was determined using the target number of shares granted multiplied by the closing stock price on the grant | |
| EXECUTIVE COMPENSATION |
| Stock Awards | ||||||
| Name | Date Awarded | Number of Shares of Stock That Have Not Vested(#) | Market Value of Shares of Stock that Have Not Vested ($) | Equity Incentive Plan Awards: Number of Unearned Shares That Have Not Vested(#) | Equity Incentive Plan Awards: Market or Payout Value of Unearned Shares That Have Not Vested($) | |
| Smith | 1/30/19(1) | 725 | 21,678 | |||
1/23/20(2) | 44,800 | 1,339,520 | ||||
1/23/20(3) | 7,680 | 229,632 | ||||
1/23/20(4) | 2,640 | 78,936 | ||||
1/21/21(5) | 37,352 | 1,116,825 | ||||
1/21/21(6) | 6,670 | 199,433 | ||||
1/21/21(4) | 4,402 | 131,620 | ||||
1/26/22(7) | 26,612 | 795,699 | ||||
1/26/22(8) | 6,487 | 193,961 | ||||
1/26/22(4) | 7,701 | 230,260 | ||||
| Burdette | 1/31/19(1) | 997 | 29,810 | |||
1/23/20(2) | 13,377 | 399,972 | ||||
1/23/20(3) | 2,293 | 68,561 | ||||
1/23/20(4) | 1,351 | 40,395 | ||||
1/21/21(5) | 9,849 | 294,485 | ||||
1/21/21(6) | 1,759 | 52,594 | ||||
1/21/21(4) | 1,990 | 59,501 | ||||
5/01/21(4) | 3,300 | 98,670 | ||||
2/23/22(7) | 7,787 | 232,831 | ||||
2/23/22(8) | 1,899 | 56,780 | ||||
2/23/22(4) | 4,000 | 119,600 | ||||
| Hare | 1/31/19(1) | 997 | 29,810 | |||
1/23/20(2) | 13,377 | 399,972 | ||||
1/23/20(3) | 2,293 | 68,561 | ||||
1/23/20(4) | 1,351 | 40,395 | ||||
1/21/21(5) | 10,290 | 307,671 | ||||
1/21/21(6) | 1,838 | 54,956 | ||||
1/23/21(4) | 2,079 | 62,162 | ||||
2/23/22(7) | 6,853 | 204,905 | ||||
2/23/22(8) | 1,671 | 49,963 | ||||
2/23/22(4) | 3,520 | 105,248 | ||||
| Clary | 1/31/19(1) | 862 | 25,774 | |||
1/23/20(2) | 11,025 | 329,648 | ||||
1/23/20(3) | 1,890 | 56,511 | ||||
1/23/20(4) | 1,114 | 33,309 | ||||
1/21/21(5) | 8,218 | 245,718 | ||||
1/21/21(6) | 1,468 | 43,893 | ||||
1/21/21(4) | 1,660 | 49,634 | ||||
1/26/22(7) | 5,063 | 151,384 | ||||
1/26/22(8) | 1,234 | 36,897 | ||||
1/26/22(4) | 2,600 | 77,740 | ||||
| Gill | 1/31/19(1) | 850 | 25,415 | |||
1/23/20(2) | 11,025 | 329,648 | ||||
1/23/20(3) | 1,890 | 56,511 | ||||
1/23/20(4) | 1,114 | 33,309 | ||||
1/21/21(5) | 8,218 | 245,718 | ||||
1/21/21(6) | 1,468 | 43,893 | ||||
1/21/21(4) | 1,660 | 49,634 | ||||
1/26/22(7) | 5,063 | 151,384 | ||||
1/26/22(8) | 1,234 | 36,897 | ||||
1/26/22(4) | 2,600 | 77,740 | ||||
| SSARs Awards | Stock Awards | |||||||||||||||||||
| Name | Date Awarded | Number of Securities Underlying Exercisable Awards (#) | Number of Securities Underlying Unexercisable Awards (#) | Exercise Price ($) | Expiration Date | Number of Shares of Stock That Have Not Vested(#) | Market Value of Shares of Stock that Have Not Vested ($) | Equity Incentive Plan Awards: Number of Unearned Shares, Units, That Have Not Vested(#) | Equity Incentive Plan Awards: Market or Payout Value of Unearned Shares, Units, That Have Not Vested($) | |||||||||||
| Smith | 1/24/13 | (1) | 22,000 | $18.14 | 1/24/20 | |||||||||||||||
| 1/17/14 | (3) | 970 | 21,971 | |||||||||||||||||
| 1/23/15 | (4) | 13,152 | 297,893 | |||||||||||||||||
| 1/23/15 | (3) | 1,422 | 32,208 | 1,422 | 32,208 | |||||||||||||||
| 1/26/16 | (5) | 16,109 | 364,869 | |||||||||||||||||
| 1/26/16 | (3) | 3,269 | 74,043 | |||||||||||||||||
| 1/30/17 | (6) | 14,384 | 325,798 | |||||||||||||||||
| 1/30/17 | (3) | 4,950 | 112,117 | |||||||||||||||||
Hare | 5/04/17 | (7) | 4,396 | 99,569 | ||||||||||||||||
| 5/04/17 | (6) | 4,106 | 93,000 | |||||||||||||||||
| Fink | 1/17/14 | (2) | 985 | 22,310 | ||||||||||||||||
| 1/23/15 | (2) | 2,437 | 55,198 | |||||||||||||||||
| 1/23/15 | (4) | 4,831 | 109,422 | |||||||||||||||||
| 1/26/16 | (5) | 8,285 | 187,655 | |||||||||||||||||
Burdette | 1/17/14 | (2) | 907 | 20,544 | ||||||||||||||||
| 1/23/15 | (2) | 2,312 | 52,367 | |||||||||||||||||
| 1/23/15 | (4) | 4,583 | 103,805 | |||||||||||||||||
| 1/26/16 | (7) | 3,987 | 90,306 | |||||||||||||||||
| 1/26/16 | (5) | 5,615 | 127,180 | |||||||||||||||||
| 1/30/17 | (7) | 5,250 | 118,913 | |||||||||||||||||
| 1/30/17 | (6) | 4,904 | 111,076 | |||||||||||||||||
Gallagher | 1/17/14 | (2) | 907 | 20,544 | ||||||||||||||||
| 1/23/15 | (2) | 2,250 | 50,963 | |||||||||||||||||
| 1/23/15 | (4) | 4,459 | 100,996 | |||||||||||||||||
| 1/26/16 | (7) | 3,879 | 87,859 | |||||||||||||||||
| 1/26/16 | (5) | 5,463 | 123,737 | |||||||||||||||||
| 1/30/17 | (7) | 5,250 | 118,913 | |||||||||||||||||
| 1/30/17 | (6) | 4,904 | 111,076 | |||||||||||||||||
Clary | 1/24/13 | (1) | 12,500 | $18.14 | 1/24/20 | |||||||||||||||
| 1/17/14 | (2) | 907 | 20,544 | |||||||||||||||||
| 1/23/15 | (2) | 2,156 | 48,833 | |||||||||||||||||
| 1/23/15 | (4) | 4,274 | 96,806 | |||||||||||||||||
| 1/26/16 | (7) | 3,825 | 86,636 | |||||||||||||||||
| 1/26/16 | (5) | 5,387 | 122,016 | |||||||||||||||||
| 1/30/17 | (7) | 5,000 | 113,250 | |||||||||||||||||
| 1/30/17 | (6) | 4,670 | 105,776 | |||||||||||||||||
| EXECUTIVE COMPENSATION |
| Award Information | Vesting Rate | Vesting Dates | Conditions | |
| (1) | Restricted Stock Units | 25% per year | May 8 each year beginning year following grant date | Continued employment through vesting date. |
| (2) | Performance Restricted Stock Units | 100% | February 28, 2023 | Based on 2020 EBITDA, shares achieved at 175% of target. |
| (3) | Performance Restricted Stock Units | 100% | February 28, 2023 | Based on 2020 comparable store sales, shares achieved at 120% of target. |
| (4) | Restricted Stock Units | one-third per year | May 8 each year beginning year following grant date | Continued employment through vesting date. |
| (5) | Performance Restricted Stock Units | 100% | February 28, 2024 | Based on 2021 EBITDA, shares achieved at 175% of target. |
| (6) | Performance Restricted Stock Units | 100% | February 28, 2024 | Based on 2021 consolidated sales, shares achieved at 125% of target. |
| (7) | Performance Restricted Stock Units | 100% | February 28, 2025 | Based on 2022 EBITDA, shares achieved at 104.3% of target. |
| (8) | Performance Restricted Stock Units | 100% | February 28, 2025 | Based on 2022 consolidated sales, shares achieved at 101.7% of target. |
| Award Information | Vesting Rate | Vesting Dates | Conditions | |
| (1) | Stock-Settled Appreciation Rights | 25% per year | May 8 each year beginning year following grant date | Continued employment or normal retirement through vesting date. |
| (2) | Restricted Stock Units | 25% per year | May 8 each year beginning year following grant date | Continued employment or normal retirement through vesting date. |
| (3) | Performance Restricted Stock Units | 25% per year | May 8 each year beginning year following grant date | Contingent upon achieving certain level of annual net sales. |
| (4) | Performance Restricted Stock Units | 100% | February 28, 2018 | Based on 2015 EBITDA, shares achieved at 99.1% of target. |
| (5) | Performance Restricted Stock Units | 100% | February 28, 2019 | Based on 2016 EBITDA, shares achieved at 105.6% of target. |
| (6) | Performance Restricted Stock Units | 100% | February 28, 2020 | Based on 2017 EBITDA shares achieved at 93.4% of target. |
| (7) | Restricted Stock Units | 25% per year | May 8 each year beginning year following grant date | Continued employment through vesting date. |
| Option and SSARs Awards | Stock Awards | |||||||||||||||
| Name | Number of Shares Acquired on Exercise (#) | Value Realized on Exercise ($) | Number of Shares Acquired on Vesting (#)(2) | Value Realized on Vesting ($)(1) | ||||||||||||
| Clarence Smith | — | — | 15,027 | $ | 418,567 | |||||||||||
| Steve Burdette | — | — | 8,946 | 246,990 | ||||||||||||
| Richard Hare | — | — | 7,292 | 202,001 | ||||||||||||
| Ed Clary | — | — | 6,211 | 172,103 | ||||||||||||
| John Gill | — | — | 4,974 | 137,297 | ||||||||||||
| Rawson Haverty | — | — | 5,401 | 148,774 | ||||||||||||
| Option and SSARs Awards | Stock Awards | |||||||||||||||
| Name | Number of Shares Acquired on Exercise (#)(1) | Value Realized on Exercise ($)(2) | Number of Shares Acquired on Vesting (#)(1) | Value Realized on Vesting ($)(2) | ||||||||||||
| Clarence Smith | — | $ | — | 13,474 | $ | 329,462 | ||||||||||
| Richard Hare | — | — | — | — | ||||||||||||
| Dennis Fink | 1,859 | 74,340 | 7,717 | 190,842 | ||||||||||||
| Steve Burdette | 1,820 | 69,938 | 7,721 | 191,473 | ||||||||||||
| Richard Gallagher | 2,255 | 100,750 | 7,654 | 189,758 | ||||||||||||
| Ed Clary | — | — | 7,589 | 188,094 | ||||||||||||
(1) | The value realized reflects the taxable value to the named executive officer as of the date of the |
| (2) | The number of shares acquired on vesting is the gross number, including shares surrendered to us for the payment of withholding taxes. The following table outlines the net number of shares received by the NEOs. |
Name | Net Shares Received (#) | |
| Smith | 5,812 | |
| Burdette | 4,790 | |
| Hare | 3,822 | |
| Clary | 3,254 | |
| Gill | 2,740 | |
| Haverty | 3,351 |
| EXECUTIVE COMPENSATION |
Name | Aggregate Earnings (Loss) in 2022 ($) | Aggregate Withdrawals/Distributions in 2021 ($) | Aggregate Balance at Last FYE ($) | |||||||||
| Clarence Smith | $ | (77,575 | ) | — | $ | 325,795 | ||||||
| Ed Clary | (84,648 | ) | — | 541,629 | ||||||||
Name | Aggregate Earnings (Loss) in 2017 ($) | Aggregate Balance at Last FYE ($) | ||||||
| Clarence Smith | $ | 140,034 | $ | 953,677 | ||||
| Dennis Fink | 69,254 | 361,207 | ||||||
| Ed Clary | 69,126 | 364,903 | ||||||
Name | Executive Contributions in 2017 ($)(1) | Company Contributions for 2017 ($)(2) | Aggregate Earnings (Loss) in 2017 ($)(3) | Aggregate Withdrawals/ Distributions in 2017 ($) | Aggregate Balance at Last FYE ($)(4) | |||||||||||||||
| Clarence Smith | $ | 392,773 | $ | 30,072 | $ | 253,558 | — | $ | 2,111,519 | |||||||||||
| Dennis Fink | 99,270 | — | 6,284 | — | 380,013 | |||||||||||||||
| Steve Burdette | 39,625 | 9,338 | 19,584 | $ | 29,835 | 150,047 | ||||||||||||||
| Richard Gallagher | 77,108 | 8,866 | 34,736 | — | 306,584 | |||||||||||||||
| Ed Clary | 55,417 | 8,733 | 33,255 | — | 214,168 | |||||||||||||||
| Name | Executive Contributions in 2022 ($)(1) | Company Contributions for 2022 ($)(2) | Aggregate Earnings (Loss) in 2022 ($)(3) | Aggregate Withdrawals/Distributions in 2022 ($) | Aggregate Balance at Last FYE ($)(4) | |||||||||||||||
| Clarence Smith | $ | 5,750 | $ | — | $ | (685,572 | ) | $ | (99,912 | ) | $ | 3,690,337 | ||||||||
| Steve Burdette | 142,275 | 20,670 | (84,290 | ) | — | 437,829 | ||||||||||||||
| Richard Hare | — | — | (40,134 | ) | — | 215,396 | ||||||||||||||
| Ed Clary | 3,833 | 4,000 | (125,062 | ) | — | 555,300 | ||||||||||||||
| Rawson Haverty | 25,251 | 17,500 | (76,997 | ) | — | 239,331 | ||||||||||||||
(1) | Amounts included in this column have been included for the applicable year in the |
(2) | Amounts included in this column have been reported for the applicable year in the |
(3) | Amounts included in this column do not constitute above-market or preferential earnings and accordingly such amounts are not reported in the |
(4) | All amounts included in this column have been reported in the current or prior years as either salary, non-equity incentive compensation or all other compensation in the summary compensation tables or as earnings or withdrawals in the deferred compensation tables. |
| EXECUTIVE COMPENSATION |
Name | Plan Name | Number of Years Credited Service (#) | Present Value of Accumulated Benefit ($) | Payments during last fiscal year ($) | |||||||||
| Clarence Smith | SERP | 40 | $ | 498,233 | — | ||||||||
| Dennis Fink | SERP | 23 | 684,138 | $ | 42,942 | ||||||||
| Steve Burdette | SERP | 32 | 271,698 | ||||||||||
| Richard Gallagher | SERP | 27 | 378,796 | — | |||||||||
| Ed Clary | SERP | 25 | 427,154 | — | |||||||||
Name | Plan Name | Number of Years Credited Service (#) | Present Value of Accumulated Benefit ($) | Payments during last fiscal year ($) | |||||||||
| Clarence Smith | SERP | 40 | $ | 678,164 | — | ||||||||
| Steve Burdette | SERP | 32 | 258,732 | — | |||||||||
| Ed Clary | SERP | 25 | 406,590 | — | |||||||||
| John Gill | SERP | 15 | 109,865 | — | |||||||||
| Rawson Haverty | SERP | 33 | 535,994 | — | |||||||||
| EXECUTIVE COMPENSATION |
| EXECUTIVE COMPENSATION |
| Name | Voluntary | Involuntary Not for Cause | For Cause | Change in Control No Termination | Involuntary for Good Reason/Not for Cause (CIC) | Death | Disability | |||||||||||||||||||||
| Clarence Smith | ||||||||||||||||||||||||||||
| Severance | — | — | — | — | $ | 3,337,608 | — | — | ||||||||||||||||||||
| Healthcare and Other | — | — | — | — | 40,191 | — | — | |||||||||||||||||||||
| Long-Term Incentive | — | (2) | — | — | $ | 4,337,563 | 4,337,563 | $ | 4,337,563 | (3) | $ | 4,337,563 | (3) | |||||||||||||||
Retirement Plans(1) | — | — | — | — | — | — | — | |||||||||||||||||||||
| Steve Burdette | ||||||||||||||||||||||||||||
| Severance | — | — | — | — | 1,803,176 | — | — | |||||||||||||||||||||
| Healthcare and Other | — | — | — | — | 40,191 | — | — | |||||||||||||||||||||
| Long-Term Incentive | — | — | — | 1,453,200 | 1,453,200 | 1,453,200 | (3) | 1,453,200 | (3) | |||||||||||||||||||
Retirement Plans(1) | — | — | — | — | — | — | — | |||||||||||||||||||||
| Richard Hare | ||||||||||||||||||||||||||||
| Severance | — | — | — | — | 1,601,902 | — | — | |||||||||||||||||||||
| Healthcare and Other | — | — | — | — | 61,623 | — | — | |||||||||||||||||||||
| Long-Term Incentive | — | — | — | 1,323,643 | 1,323,643 | 1,323,643 | (3) | 1,323,643 | (3) | |||||||||||||||||||
Retirement Plans(1) | — | — | — | — | — | — | — | |||||||||||||||||||||
| Ed Clary | ||||||||||||||||||||||||||||
| Severance | — | — | — | — | 1,436,950 | — | — | |||||||||||||||||||||
| Healthcare and Other | — | — | — | — | 40,191 | — | — | |||||||||||||||||||||
| Long-Term Incentive | — | — | — | 1,050,507 | 1,050,507 | 1,050,507 | (3) | 1,050,507 | (3) | |||||||||||||||||||
Retirement Plans(1) | — | — | — | — | — | — | — | |||||||||||||||||||||
| John Gill | ||||||||||||||||||||||||||||
| Severance | — | — | — | — | 1,436,950 | — | — | |||||||||||||||||||||
| Healthcare and Other | — | — | — | — | 40,191 | — | — | |||||||||||||||||||||
| Long-Term Incentive | — | — | — | 1,050,148 | 1,050,148 | 1,050,148 | (3) | 1,050,148 | (3) | |||||||||||||||||||
Retirement Plans(1) | — | — | — | — | — | — | — | |||||||||||||||||||||
| Rawson Haverty | ||||||||||||||||||||||||||||
| Severance | — | — | — | — | 1,165,424 | — | — | |||||||||||||||||||||
| Healthcare and Other | — | — | — | — | 61,623 | — | — | |||||||||||||||||||||
Retirement Plans(1) | — | — | — | — | — | — | — | |||||||||||||||||||||
| (1) | We disclose the amounts related to the SERP plan and the plans in which each NEO participates in the Pension Benefits, the Top Hat Mutual Fund Option Plan and the Deferred Compensation Plan tables. |
| (2) | Mr. Smith was at full retirement age at December 31, 2022. If he had retired on such date, his outstanding awards would not have automatically vested. Therefore, we report zero value in the table above. However, some of his awards would continue to vest following his retirement through the end of the respective vesting periods. The values of such awards at December 31, 2022 were $4,105,330. |
| (3) | Time-based RSUs vest in full upon an NEO’s termination of employment by reason of death or disability. Similarly, PRSUs generally vest upon an NEO’s termination of employment by reason of death or disability based on actual performance through the date of death or disability, which for purposes of this table is assumed to be December 31, 2022. |
| EXECUTIVE COMPENSATION |
| Name | Voluntary | Involuntary Not for Cause | For Cause | Involuntary for Good Reason/Not for Cause (CIC) | Death | Disability | |||||||
| Clarence Smith | |||||||||||||
| Severance | — | — | — | $1,300,000 | — | — | |||||||
| Bonus | — | — | — | 1,095,138 | — | — | |||||||
| Healthcare and Other | — | — | — | 61,224 | — | — | |||||||
| Long-Term Incentive | — | (2) | — | — | 1,715,704 | $1,141,959 | (3) | $1,141,959 | (3) | ||||
Retirement Plans(1) | �� — | — | — | — | — | — | |||||||
| Richard Hare | |||||||||||||
| Severance | — | — | — | 740,000 | — | — | |||||||
| Bonus | — | — | — | 344,456 | — | — | |||||||
| Healthcare and Other | — | — | — | 69,320 | — | — | |||||||
| Long-Term Incentive | — | — | — | 231,467 | 192,569 | (3) | 192,569 | (3) | |||||
Retirement Plans(1) | — | — | — | — | — | — | |||||||
| Dennis Fink | |||||||||||||
| Severance | — | — | — | — | — | — | |||||||
| Bonus | — | — | — | — | — | — | |||||||
| Healthcare and Other | — | — | — | — | — | — | |||||||
| Long-Term Incentive | $374,585 | (2) | — | — | — | — | — | ||||||
Retirement Plans(1) | 42,942 | — | — | — | — | — | |||||||
| Steve Burdette | |||||||||||||
| Severance | — | — | — | 740,000 | — | — | |||||||
| Bonus | — | — | — | 379,292 | — | — | |||||||
| Healthcare and Other | — | — | — | 37,802 | — | — | |||||||
| Long-Term Incentive | — | — | — | 750,267 | 624,191 | (3) | 624,191 | (3) | |||||
Retirement Plans(1) | — | — | — | — | — | — | |||||||
| Richard Gallagher | |||||||||||||
| Severance | — | — | — | 720,000 | — | — | |||||||
| Bonus | — | — | — | 369,682 | — | — | |||||||
| Healthcare and Other | — | — | — | 77,123 | — | — | |||||||
| Long-Term Incentive | — | — | — | 738,124 | 614,088 | (3) | 614,088 | (3) | |||||
Retirement Plans(1) | — | — | — | — | — | — | |||||||
| Ed Clary | |||||||||||||
| Severance | — | — | — | 710,000 | — | — | |||||||
| Bonus | — | — | — | 374,962 | — | — | |||||||
| Healthcare and Other | — | — | — | 79,398 | — | — | |||||||
| Long-Term Incentive | — | — | — | 827,375 | 650,236 | (3) | 650,236 | (3) | |||||
Retirement Plans(1) | — | — | — | — | — | — |
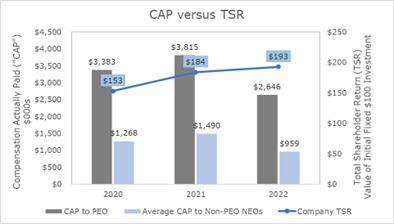
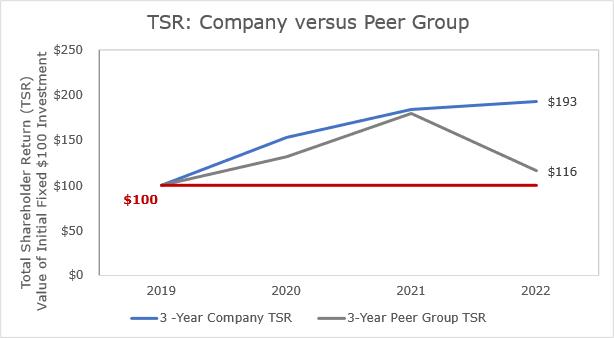
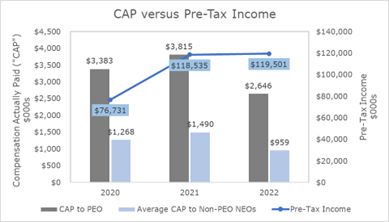
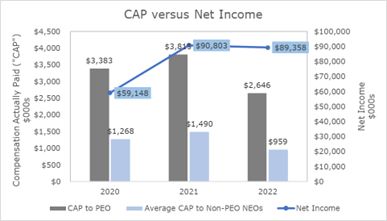
Pay-Versus-Performance |
| Value of Initial Fixed $100 Investment | Company Selected Financial Performance Measure | |||||||||||||||||||||||||||||||
| Year | SCT Total Compensation for PEO(1) | Compensation Actually Paid to PEO | Average SCT Total Compensation For Non-PEO NEOs(2) | Average Compensation Actually Paid to Non-PEO NEOs | Total Shareholder Return | Peer Group Total Shareholder Return(3) | Net Income(4) (in 000s) | Pre-Tax Income(5) (in 000s) | ||||||||||||||||||||||||
| (a) | (b) | (c) | (d) | (e) | (f) | (g) | (h) | (i) | ||||||||||||||||||||||||
| 2022 | $ | 2,679,191 | $ | 2,646,013 | $ | 1,170,014 | $ | 959,065 | 193 | 116 | $ | 89,358 | $ | 119,501 | ||||||||||||||||||
| 2021 | 3,161,832 | 3,814,594 | 1,215,126 | 1,490,490 | 184 | 180 | 90,803 | 118,535 | ||||||||||||||||||||||||
| 2020 | 2,437,008 | 3,382,845 | 1,013,649 | 1,268,297 | 153 | 132 | 59,148 | 76,731 | ||||||||||||||||||||||||
| 1. | Clarence Smith served as our CEO for the entirety of 2022, 2021 and 2020. |
| 2. | The NEOs included in this calculation for each year are: |
| 3. | The peer group TSR is based on the cumulative return of the NYSE/AMEX/Nasdaq Home Furnishings & Equipment Stores Index (SIC Codes 5700-5799). |
| 4. | Net income as reported in the company’s consolidated financial statements included in our 2022 Annual Report on Form 10-K. |
| 5. | Pre-tax income, or income before income taxes, as reported in the company’s consolidated financial statements included in our 2022 Annual Report on Form 10-K. |
| 6. | The additional table below sets forth each of the amounts required by SEC rule to be deducted from and added to the amount of total compensation as reflected in the Summary Compensation Table, to calculate CAP. There were no assumptions made in the valuation of equity awards that differs materially from those disclosed as of the grant date of such equity awards. |
| EXECUTIVE COMPENSATION |
| 2022 | 2021 | 2020 | ||||||||||||||||||||||
| PEO | Other NEOs Average | PEO | Other NEOs Average | PEO | Other NEOs Average | |||||||||||||||||||
| Total Compensation from SCT | $ | 2,679,191 | $ | 1,170,014 | $ | 3,161,832 | $ | 1,215,126 | $ | 2,437,008 | $ | 1,013,649 | ||||||||||||
DEDUCT: grant date fair value (GDFV) of equity awards granted during FY | $ | 1,150,562 | $ | 281,772 | $ | 1,092,213 | $ | 350,958 | $ | 816,800 | $ | 254,229 | ||||||||||||
ADD: FV as of FY-end of equity awards granted during the year that are outstanding and unvested as of FY-end | $ | 1,219,920 | $ | 260,274 | $ | 1,549,655 | $ | 453,223 | $ | 1,673,482 | $ | 498,822 | ||||||||||||
ADD: change as of end of FY in FV of awards granted in any prior year that are outstanding and unvested as of FY-end | $ | (69,860 | ) | $ | (16,027 | ) | $ | 198,163 | $ | 63,599 | $ | 197,468 | $ | 89,305 | ||||||||||
ADD: change as of the vesting date (from end of prior FY) in FV for any equity awards granted in any prior year that vested at the end of or during FY | $ | (32,676 | ) | $ | (19,253 | ) | $ | 199,538 | $ | 109,500 | $ | (57,482 | ) | $ | (37,018 | ) | ||||||||
DEDUCT: FV at the end of the prior FY for awards granted in any prior year that failed to meet applicable vesting conditions or were cancelled during FY | $ | — | $ | 154,171 | $ | — | $ | — | $ | 33,264 | $ | — | ||||||||||||
DEDUCT: change in actuarial present value of the accumulated benefit under all defined benefit and actuarial pension plans reported in SCT(1) | $ | — | $ | — | $ | 202,381 | $ | — | $ | 17,567 | $ | 42,232 | ||||||||||||
| Compensation Actually Paid (CAP) (as defined by SEC rule) | $ | 2,646,013 | $ | 959,065 | $ | 3,814,594 | $ | 1,490,490 | $ | 3,382,845 | $ | 1,268,297 | ||||||||||||
| (1) | As discussed on page 25, the SERP Plan was frozen in 2006 and accordingly there are no changes related to service costs and prior service costs. |
| EXECUTIVE COMPENSATION |
| EXECUTIVE COMPENSATION |
| PROPOSAL 3: ADVISORY VOTE ON EXECUTIVE COMPENSATION |
What am I voting on? | ✓ Advisory vote to approve named executive officers’ compensation (“say-on-pay-vote”). |
| Voting recommendation: | ✓ Our board of directors recommends a vote “For” approval, on a non-binding, advisory basis, of the compensation paid to our named executive officers. |
EQUITY COMPENSATION PLAN INFORMATION |
| Plan Category | Number of Securities To be issued upon exercise of outstanding equity awards (a) | Weighted-average exercise price of outstanding options and stock-settled stock appreciation rights (SSARs) (b) | Number of securities remaining available for future issuance under equity compensation plans (excluding securities reflected in Column (a)) (c) | Number of Securities To be issued upon exercise of outstanding equity awards (a) | Weighted-average exercise price of outstanding options and stock-settled stock appreciation rights (SSARs) (b) | Number of securities remaining available for future issuance under equity compensation plans (excluding securities reflected in Column (a)) (c) | |||||||||||||
| Equity compensation plans approved by stockholders: | |||||||||||||||||||
Long-Term Incentive Plans(1) | 491,264 | (2) | $ | 18.14 | 838,209 | (3) | 677,701 (2) | — | 1,240,915 (3) | ||||||||||
| Director Compensation Plan | 197,804 | (4) | — | 235,221 | (5) | ||||||||||||||
| Non-Employee Director Compensation Plan | 142,027 (4) | — | 8,988(5) | ||||||||||||||||
| Equity compensation plans not approved by stockholders | — | — | — | — | — | — | |||||||||||||
| Total | 689,068 | $ | 18.14 | 1,073,430 | 819,728 | — | 1,249,903 | ||||||||||||
| (1) | Shares issuable pursuant to outstanding equity awards under our 2014 |
| (2) | This number |
| (3) | Any shares from the 2014 LTIP which are forfeited, expired, or cancelled are not made available for use under the 2021 LTIP. Any shares from the 2021 LTIP which are forfeited, expired, or |
| (4) | Shares deferred under the |
| (5) | Shares remaining under the Directors Compensation Plan. Shares are issued from those held in the |
| AUDIT COMMITTEE REPORT |
The Audit Committee oversees Havertys’ financial reporting process on behalf of the board. Havertys’ management has the primary responsibility for the financial statements, for maintaining effective internal control over financial reporting, and for assessing the effectiveness of internal control over financial reporting. Havertys’ independent registered public accounting firm, or “independent accountants,” is responsible for auditing its consolidated financial statements and providing an opinion as to their conformity with accounting principles generally accepted in the United States as well as attesting and reporting on the effectiveness of its internal controls over financial reporting. The Audit Committee’s responsibility is to monitor and review these processes. It is not the Audit Committee’s duty or responsibility to conduct auditing or accounting reviews or procedures. Consequently, in carrying out its oversight responsibilities, it shall not be charged with, and is not providing, any expert or special assurance as to Havertys’ financial statements, or any professional certification as to the independent accountants’ work. In addition, the Audit Committee has relied on management’s representation that the financial statements have been prepared with integrity and objectively in conformity with accounting principles generally accepted in the United States and on the representations of an independent registered public accounting firm included in its report on Havertys’ financial statements. The Audit Committee is comprised entirely of four independent directors as defined by the NYSE listing standards and Rule 10A-3 of the Securities Exchange Act of 1934. The Audit Committee is governed by a charter that enumerates its purpose and responsibilities, a copy of which is available on Havertys’ website at https://ir.havertys.com/corporate-governance-information/corporate-governance-documents. The Audit Committee met four times during 2022 and schedules its meetings to ensure enough time is available to devote attention to its tasks. In carrying out its responsibilities, the Audit Committee among other things: •meets with management and the independent registered public accounting firm, Grant Thornton LLP (“Grant Thornton”) to review and discuss Havertys’ accounting policies and significant estimates; •discusses with Havertys’ internal auditors and Grant Thornton the overall scope and plans for their respective audits; •meets with both the internal auditors and Grant Thornton, with and without management present, to discuss the results of their examinations; •reviews and discusses quarterly and annual financial reports prior to filing with the SEC and quarterly earnings press releases; •supervises the relationship between Havertys and Grant Thornton, including having direct responsibility for Grant Thornton’s appointment, compensation, retention, and oversight; reviewing the scope of their audit services; approving audit and non-audit services; and confirming Grant Thornton’s independence; •reviews with senior management significant risks and the processes by which risk is identified, assessed, and mitigated; and •selects for the stockholders’ ratification, the independent registered public accounting firm for 2023. |
| AUDIT COMMITTEE REPORT (continued) |
The Audit Committee further discussed with representatives of Grant Thornton the matters required to be discussed with audit committees by the applicable requirements of the Public Company Accounting Oversight Board's standards and the SEC. The Committee also received the written disclosures and the letter from Grant Thornton required by the applicable requirements of the Public Company Accounting Oversight Board regarding Grant Thornton’s communications with the Committee concerning independence and discussed with representatives of Grant Thornton the independence of that firm. The Audit Committee also reviewed and discussed together with management and Grant Thornton, Havertys’ audited financial statements for the year ended December 31, 2022, and the results of management's assessments of the effectiveness of the company’s internal control over financial reporting and Grant Thornton’s audit of internal control over financial reporting. Based on these reviews and discussions, the Audit Committee recommended to the board that the audited financial statements be included in Havertys’ Annual Report on Form 10‑K for the year ended December 31, 2022. The Audit Committee Al Trujillo, Chair Michael R. Cote G. Thomas Hough Vicki R. Palmer This report shall not be deemed to be “soliciting material” or to be “filed” with the SEC nor shall this report be incorporated by reference by any general statement incorporating by reference this proxy statement into any filing under the Securities Act of 1933, as amended, or the Securities Exchange Act of 1934, as amended, and shall not otherwise be deemed filed under such acts. |
AUDIT MATTERS |
| Item | 2022 | 2021 | ||||||
| Audit Fees (a) | $ | 732,000 | $ | 659,000 | ||||
| Audit–Related Fees (b) | — | — | ||||||
| Tax Fees (c) | 24,000 | 21,000 | ||||||
| All Other Fees (d) | — | 118,000 | ||||||
| $ | 756,000 | $ | 798,000 | |||||
| December 31, | ||||||||
| 2017 | 2016 | |||||||
| Audit Fees | $ | 529,643 | $ | 525,505 | ||||
| Audit-related | — | — | ||||||
| Tax | — | — | ||||||
| All other | 7,022 | 4,492 | ||||||
| Total | $ | 536,665 | $ | 529,997 | ||||
| What am I voting on? | ✓Ratification of the |
| Voting recommendation: | ✓Our board of directors recommends a vote |
OWNERSHIP OF SECURITIES |
| Common Stock | Class A Common Stock | |||||||||||||||
| Name and address of Beneficial Holder | Amount and Nature of Beneficial Ownership | Percent of Class(1) | Amount and Nature of Beneficial Ownership | Percent of Class(2) | ||||||||||||
BlackRock, Inc. 55 East 52nd Street, New York, NY | 2,735,031 | (3) | 18.3 | % | — | — | ||||||||||
The Burton Partnership, LP 614 W. Bay Street, Tampa, FL | 1,228,255 | (4) | 8.2 | % | — | — | ||||||||||
Dimensional Fund Advisors LP 6300 Bee Cave Road, Building One, Austin, TX | 1,223,631 | (5) | 8.2 | % | — | — | ||||||||||
Renaissance Technologies LLC 800 Third Avenue, New York, NY | 838,406 | (6) | 5.6 | % | — | — | ||||||||||
The Vanguard Group 100 Vanguard Blvd., Malvern, PA | 967,943 | (7) | 6.5 | % | — | — | ||||||||||
LSV Asset Management 155 N. Wacker Drive, Suite 4600, Chicago, IL | 745,600 | (8) | 5.0 | % | — | — | ||||||||||
Villa Clare Partners, L.P. 158 West Wesley Road, Atlanta, GA | — | — | 603,497 | (9) | 47.0 | % | ||||||||||
Rawson Haverty, Jr. 780 Johnson Ferry Road, NE, Atlanta, GA | 15,000 | (10) | * | 186,959 | (10)(11) | 14.6 | % | |||||||||
Clarence H. Smith 780 Johnson Ferry Road, NE, Atlanta, GA | 77,380 | (12)(13) | * | 113,986 | (14) | 8.9 | % | |||||||||
| (1) | Based on 14,981,347 shares of our common stock outstanding on March 10, 2023. | |||||
| (2) | Based on 1,283,260 shares of our Class A common stock outstanding on March 10, 2023. | |||||
| (3) | According to a Schedule 13G filed on January 26, 2023, BlackRock, Inc. holds sole voting power over 2,659,938 shares and sole dispositive power over 2,735,031 shares of common stock. | |||||
| (4) | According to a Schedule 13G filed on June 1, 2016, The Burton Partnership, LP, The Burton Partnership (QP), LP and Donald W. Burton, General Partner, hold sole voting and dispositive power over 1,228,255 shares of common stock. | |||||
| (5) | According to a Schedule 13G/A filed on February 10, 2023, Dimensional Fund Advisors LP (“Dimensional”) holds sole voting power over 1,205,761 shares and sole dispositive power over 1,223,631 shares of common stock. Dimensional is an investment advisor registered under Section 203 of the Investment Advisors Act of 1940 and furnishes investment advice to four investment companies registered under the Investment Company Act of 1940 and serves as investment manager or sub-advisor to certain other commingled funds, group trusts and separate accounts (the “Funds”). The shares reported above are owned by the Funds. Dimensional possesses investment and/or voting power over the shares held by the Funds. Dimensional disclaims beneficial ownership of these securities. | |||||
| (6) | According to a Schedule 13G/A filed on February 13, 2023, Renaissance Technologies LLC holds sole voting and dispositive power over 838,406 shares of common stock. | |||||
| (7) | According to a Schedule 13G/A filed on February 9, 2023, The Vanguard Group holds shared voting power over 9,756 shares and sole dispositive power over 946,743 shares and shared dispositive power over 21,200 shares of common stock. | |||||
| (8) | According to a Schedule 13G filed on February 10, 2023, LSV Asset Management holds sole voting power over 440,100 shares and sole dispositive power over 745,600 shares of common stock. | |||||
| (9) | According to a Schedule 13D/A filed on January 3, 2018, Villa Clare Partners, L.P. holds shared voting and dispositive power over 603,497 shares of Class A common stock. Clarence H. Smith is the manager of the Partnership’s general partner, West Wesley Associates, LLC. Mr. Smith disclaims beneficial ownership of these shares except to the extent of his partnership interest. | |||||
| (10) | Mr. Haverty has direct ownership of 84,074 shares of Class A common stock and sole dispositive and voting power over 65,140 shares of Class A common stock held by a limited liability company for which Mr. Haverty is the manager. The beneficial ownership disclosed also includes 8,728 shares of Class A common stock held in trust for the benefit of Mr. Haverty’s child, for which he is co‑trustee, as to which he disclaims beneficial ownership. | |||||
| (11) | The Mary E. Haverty Foundation is a charitable organization, for which Mr. Haverty has sole voting power through a revocable proxy granted to him by the Foundation. Mr. Haverty has no pecuniary interest in the shares of the Foundation and disclaims any beneficial ownership in the Foundation’s shares. The amounts shown reflect 15,000 shares of common stock and 29,017 shares of Class A common stock, respectively. | |||||
| (12) | Mr. Smith has direct ownership of 34,300 shares of common stock. The beneficial ownership disclosed includes 29,689 shares of common stock held by Mr. Smith’s wife, as to which he disclaims beneficial ownership. Mr. Smith also has 5,541 shares beneficially owned under Havertys’ directors’ Deferred Plan. | |||||
| (13) | This amount includes 7,850 shares of common stock held by a Georgia limited partnership in which Mr. Smith is a partner. Mr. Smith disclaims beneficial ownership of these shares except to the extent of his pecuniary interest in the partnership. | |||||
| (14) | Mr. Smith has direct ownership of 112,036 shares of Class A common stock. The beneficial ownership disclosed includes 1,950 shares of Class A common stock held by Mr. Smith’s wife, as to which he disclaims beneficial ownership. | |||||
Ownership by OurDirectors and Management |
| Common Stock | Class A Common Stock | |||||||||
Amount and Nature of Beneficial Ownership (1) | Percent of Class(2) | Shares Beneficially Owned | Percent of Class(3) | |||||||
| Steven G. Burdette | 13,351 | * | 28,530 | 2.2% | ||||||
| J. Edward Clary | 38,156 | * | — | — | ||||||
| Michael R. Cote | 1,388 | * | — | — | ||||||
| L. Allison Dukes | 21,514 | * | — | — | ||||||
| John L. Gill | 15,878 | * | 7,500 | * | ||||||
| Richard B. Hare | 22,978 | * | — | — | ||||||
| Rawson Haverty, Jr. | 15,000 | (4) | * | 186,959 | (4)5) | 14.6% | ||||
| G. Thomas Hough | 25,504 | * | — | — | ||||||
| Mylle H. Mangum | 64,466 | * | — | — | ||||||
| Vicki R. Palmer | 54,718 | * | — | — | ||||||
| Derek G. Schiller | 6,660 | * | — | — | ||||||
| Clarence H. Smith | 77,380 | (6)(7) | * | 717,483 | (8)(9) | 55.9% | ||||
| Al Trujillo | 58,206 | * | — | — | ||||||
| Directors and Executive Officers as a group (16 persons) | 505,459 | 3.4% | 940,472 | 73.3% | ||||||
| (1) | This column also includes shares of common stock beneficially owned under our directors’ Deferred Plan for the following individuals: Ms. Dukes – 21,514; Mr. Hough – 11,922; Ms. Mangum – 59,308; Mr. Smith – 5,541; and Mr. Trujillo – 43,742. |
| (2) | Based on 14,981,347 shares of our common stock outstanding on March 10, 2023. |
| (3) | Based on 1,283,260 shares of our Class A common stock outstanding on March 10, 2023. |
| (4) | The Mary E. Haverty Foundation is a charitable organization, for which Mr. Haverty has sole voting power through a revocable proxy granted to him by the Foundation. Mr. Haverty has no pecuniary interest in the shares of the Foundation and disclaims any beneficial ownership in the Foundation’s shares. The amounts shown reflect 15,000 shares of common stock and 29,017 shares of Class A common stock, respectively. |
| (5) | Mr. Haverty has direct ownership of 84,074 shares of Class A common stock. The beneficial ownership disclosed also includes 65,140 shares of Class A common stock held by a limited liability company for which Mr. Haverty is the manager and 8,728 shares of Class A common stock held in trust for the benefit of Mr. Haverty’s child, for which he is co-trustee, as to which he disclaims beneficial ownership. |
| (6) | Mr. Smith has direct ownership of 34,300 shares of common stock. The beneficial ownership disclosed includes 29,689 shares of common stock held by Mr. Smith’s wife, as to which he disclaims beneficial ownership. |
| (7) | This amount includes 7,850 shares of common stock held by a Georgia limited partnership in which Mr. Smith is a partner. Mr. Smith disclaims beneficial ownership of these shares except to the extent of his pecuniary interest in the partnership. |
| (8) | Mr. Smith has direct ownership of 112,036 shares of Class A common stock. The beneficial ownership disclosed includes 1,950 shares of Class A common stock held by Mr. Smith’s wife, as to which he disclaims beneficial ownership. |
| (9) | The amount also includes shares held by a partnership. According to a Schedule 13D filed on January 3, 2018, Villa Clare Partners, L.P. holds shared voting and dispositive power over 603,497 shares of Class A common stock. Mr. Smith is the manager of the Partnership’s general partner, West Wesley Associates, LLC. Mr. Smith disclaims beneficial ownership of these shares except to the extent of his partnership interest. |
INFORMATION ABOUT OUR ANNUAL MEETING |
INFORMATION ABOUT OUR ANNUAL MEETING |
Proposals | Board Voting Recommendation | Votes Required For Approval | Abstentions | Broker non-votes |
Election of Directors – Class A Common Stockholders Common Stockholders | FOR FOR | Plurality of votes cast in person or by proxy – the most affirmative votes | No effect | No effect |
FOR | Combined majority of votes cast in person or by proxy | No effect | ||
| Advisory Vote on Executive Compensation | FOR | Combined majority of votes cast in person or by proxy | No effect | No effect |
| Ratification of the appointment of Grant Thornton LLP as | FOR | Combined majority of votes cast in person or by proxy | No effect | No effect Discretionary voting by broker permitted |
INFORMATION ABOUT OUR ANNUAL MEETING |
Stockholders Sharing the Same Address |
Available Information |

APPENDICES |
APPENDIX A — NON-EMPLOYEE DIRECTOR COMPENSATION PLAN |
Annual Retainer(1) | |
| All Non-Employee Directors | $100,000 |
| Supplemental Annual Retainers | |
| Lead Director | $12,000 |
| Audit Committee Chair | $10,000 |
| NC&G Committee | $10,000 |
| Annual Stock Grant (FMV) | |
| All Non-Employee Directors | $40,000 |
APPENDIX B — GAAP TO NON-GAAP RECONCILIATION |
Reconciliation of EBITDA |
| (in thousands) | Year Ended December 31, 2022 | |||
Income before income taxes, as reported(1) | $ | 119,501 | ||
Interest income, net(1) | (1,618 | ) | ||
Depreciation(1) | 16,926 | |||
| EBITDA | $ | 134,809 | ||
| (1) | These amounts are included in our Form 10-K for the year ended December 31, 2022. |